SGX Insider & Substantial Shareholder Activity from 20 - 24 Nov 06
Here are some of the more significant change of beneficial ownership transactions reported on the SGX for the past week:
BANYAN TREE HOLDINGS LIMITED, 21-Nov-06, The Capital Group Companies Inc, Bot 3143000 Shares
BANYAN TREE HOLDINGS LIMITED, 20-Nov-06, The Capital Group Companies Inc, Sold 555000 Shares
CNA GROUP LTD., 30-Oct-06 POPULUS FUND / NORDEA BANK FINLAND PLC, Bot 2768000 Shares
CNA GROUP LTD., 1-Nov-06, POPULUS FUND (Mutual Fund/Registered in Finland), Bot 1900000 Shares
CNA GROUP LTD., 8-Nov-06, POPULUS FUND (Mutual Fund/Registered in Finland), Bot 6745000 Shares
COSCO CORPORATION (S) LTD, 21-Nov-06 Temasek Holdings (Private) Limited, Bot 67612000 Shares
DEVOTION ECO-THERMAL LIMITED, 17-Nov-06 London Asia Chinese Private Equity Fund Limited, Bot 13000000 Shares
DMX TECHNOLOGIES GROUP LTD, 16-Nov-06 Legg Mason International Equities (Singapore) Pte. Limited, Sold 7007000 Shares
HLG ENTERPRISE LIMITED, 22-Nov-06 Davos Investment Holdings Private Limited (Davos), Bot 196201374 Shares
MAPLETREE LOGISTICS TRUST, 17-Nov-06 Temasek Holdings (Private) Limited, Bot 7240000 Shares
RAFFLES HOLDINGS LIMITED, 17-Nov-06 Temasek Holdings (Private) Limited, Bot 155199714 Shares
SARIN TECHNOLOGIES LTD, 20-Nov-06 Chartered Asset Management Pte Ltd, Bot 1621000 Shares
UNISTEEL TECHNOLOGY LTD, 21-Nov-06, FMR Corp., Bot 1455000 Shares
YELLOW PAGES(SINGAPORE)LIMITED, 17-Nov-06, Global Advisory Group Pte Ltd, Bot 5136000 Shares
Perhaps the transaction by Temasek would shed some light on the recent run by Cosco. Elsewhere, both the FTSE and Nikkei have reached short-term oversold levels while the NASDAQ remained in overbought region with very little movement as suggested by the declining volatility oscillator last week. Will the US market move down to join the FTSE and the Nikkei or will it be the other way around? I'm still of the opinion that the US market looks a little on the high side. The put-call ratio has dropped to Mar 06 levels (before that big selldown that started in April). From the chart above, call buying actually took off more significantly after the markets have rallied quite abit... seems like everyone only feels comfortable to go long after the trend is well and truly underway. The volatility oscillator has turned up back to '0' again, but the Advance-Decline line has still not fallen low enough for a high probability short-term trade.
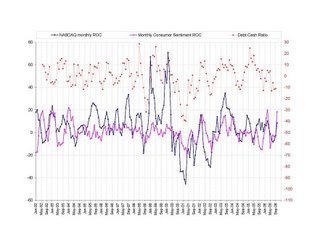
This chart and the one below should have been shown early this month when the October data became available. The one above shows the change in the NASDAQ composite, the University of Michigan Consumer Sentiment Index and the NYSE Margin-Debt Ratio. Back in July when the values of the NASDAQ and Consumer Sentiment fell to historical low levels, I calmed a friend who was quite heavily invested in the Hong Kong market (he happened to be a 'gut-feel' investor like 80% of us) that the probaility of the markets turning back around was quite high. If the market could bounce in 2001 and 2002 in the midst of a 3 and a half year recession, it can certainly bounce back in July.

The final chart of this week is the forecast chart of the Dow Jones Industrial Index till 2008. The Dow has now reached a point where the forecast predicts a downturn. Although there is every possibility that a downturn may not happen at all, but the forecast has held up really well over the past couple of years that I've got to give some weight to what it's suggesting. And analysing this chart together with the Consumer Sentiment rate-of-change, I would bet my money that a correction is starting when the weekly NASDAQ falls below its 10 or 20 EMA (Exponential Moving Average).
Have a good week!
Have a good week!


0 Comments:
Post a Comment
<< Home