MY TAKE ON INVESTING

Like everyone else, there is only one reason why I study, analyse and participate in the financial markets - and that is to make money. But the difference with me and most other people is that I am willing to use anything (legally) possible to do it. If counting the number of cockroaches that I see everyday gives me an edge in the market, I'll do it. If it works, I'll use it; be it keeping tabs on the economy, looking at charts and indicators (technical analysis), looking at value or growth potential (fundamental analysis), profits & earnings + other related market activity (quantitive analysis), through insider activity + consumer surveys (sentiment analysis) and yes even astrology.

I've spent over five years monitoring, studying, observing and trading the financial markets. My quest was to find out what makes the financial markets move, to find something substantial, something that will provide consistent monetary gains. I don't want to just accept what other authors say/write as gospel truth, I want to know why. In 2005, I took a masters degree in finance to see if what they teach in the university adds any value towards investing success - the answer is 'not really'. Investment knowledge builds up with time - what might seem unimportant to you now may become what you need to get you to the next 'level'. Such is my experience with fundamental, quantitative, economic and sentiment analysis.

What you see in this blog represents quite a number of item(s) and technique(s) that have met - like what W.D. Gann says - my '(utmost) satisfaction' and I hope that they can be of use to the investment pilgrim who's also on a quest for understanding and success.
Please Support This Blog By Clicking On The Advertisement(s) In The Sidebar If The Content Has Been Helpful To You. Thanks.

Saturday, August 11, 2007

US & Asia Pacific Equity Markets Commentary 03 - 10 Aug 07

The commentary for 03 - 10 Aug 07 have been posted and they can be viewed at:
US and Asia Pacific Equity Markets Commentary

The U.S. commentary is being done at the moment and should be up in a few hours.

The overview page is current "work in progress" and will be done if when I get the time. I've written a short section about why fundamental analysis should not be used by itself in the Australian Market commentary here. The reason why I did it was because one of my mates at Mariner Financial showed the webpage to one of his mates working at an analyst (I think), and I was immediately branded as a Technical Analyst. Not that I've any problem with that, but what he commented was very true about the retail investment funds industry - that they are all very fundamentally driven and view technical analysis as a high risk methodology.

I don't blame them for thinking like that because that's what they've been taught to believe in, and how they got the job in the first place. And when I go for interviews at such places, I had to "hide" the fact that I do technical analysis because it was frowned upon. I was telling Geoff that I might be better off "playing the game" by trying to be fundamentally inclined and get the job, and if I play it well enough, I'll hit 6-figures in 2 years as an analyst. But alas, my wretchedness got the better of me, not wanting to give in and to keep doing what I know is much better. But don't get me wrong, I believe in fundamentals and incorporate it into my methodology, I just don't use it by itself.

Went for a psychometric test for a position in Macquarie Bank last Friday, but have really no clue about the outcome. I answered the questions as truthfully as I can and hopefully I'm what they want.

Take care.

Sunday, July 22, 2007

US & Asia Pacific Equity Markets Commentary 16 - 20 Jun 07

Hi all,

Before I begin babbling, I've begin to put up the weekly commentries onto a website. However, I've only managed to complete the US market commentary. The rest will be added gradually:

http://stocklogic.007ihost.com/US.html

After three weeks of M.I.A., I'm back again. Many things have happened over the past 21 days. As usual, I've been applying for dealing/trading/research related roles with no success. One of the meetings with a recruiter however, is worth mentioning because he was the only recruiter I've met to ask me about my investment system. I didn't show him alot, only the economic indicators and the US monthly indicators chart that I publish here frequently. Those two items seemm to be enough to make an impression. He also told me that there's an anti-sentiment in Australia against the highly educated and that the country's lack of entreprenerial spirit. Nuff said about the quality of people in finance.

Last friday, my 'successor' arrived (at the office). Although the agreement was that I would stay till the end of Sept or until I find another job. But I guess my boss knew that I didn't want to stay that long and was scouting for a suitable replacement - which surprisingly turned out to be another contractor... overqualified (just like me heheh). He hailed from Germany, had a master's degree in commerce and completing a diploma with FINSIA. He was originally an analyst and subsequently came out to do collective investment deals with his mates. But the doors closed on him and he's now contracting to pay the bills.

Things I've added over the past weeks include:
- Charts of all ASX sectors
- Charts of US Economic indicators
- Weekly chart of the Hang Send Index
- Consolidated MBO + Stochastics chart

Since the US Commentary can now be viewed at the website (http://stocklogic.007ihost.com/US.html), I shall touch briefly on the Asia Pac markets here.

The down-close on the US market last friday would most likely cause abit of a stir on the Asian markets this coming Monday (23 Jul 07). The MBO readings on the Singapore, Hong Kong and Australia are all in high territory; and I am therefore expecting them to close lower (on Monday) and rebound on Tuesday if the US market closes higher. We'll just have to wait and see how the rest of the week pans out as U.S. Home Sales, GDP Forecast and Consumer Sentiment data are announced.

Have a gd week!

Tuesday, June 26, 2007

US & Asia Pacific Equity Markets Commentary 21 - 25 Jun 07

Hi all,

Once again, the commentaries are slightly late (so what's new?). The past week saw me drilling down into the Australian market a little bit deeper. The plan is to get the data for the various sector indices as well as the sector components. That way, I can then start to do some relative strength comparison among and within the sectors. With any luck, next week will be the week that I start posting the charts of the ASX sector indices on another webpage as this blog is getting abit crowded. There are 11 sector indices and posting up the charts for all of them here is not ideal.


ASIA-PACIFIC MARKETS COMMENTARY
-------------------------------------------------------

DAILY CHARTS:

The Asian markets diverged from the US Market last week due to news that the Chinese authorities has allowed financial institutions and wealth management institutions to invest "chinese money" in overseas markets.... otherwise the china stock market is gonna be greatly inflated and become more susceptible for a crash, so they thought it would be better to inflate other markets :)

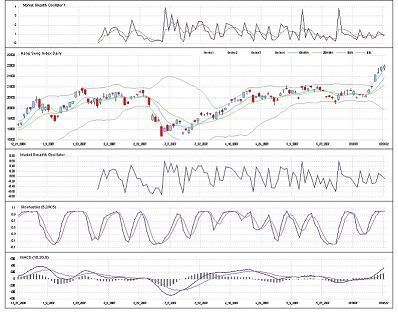
So despite the drop in the US market the night before, the Asian markets actually finished higher - especially the Hang Seng Index.

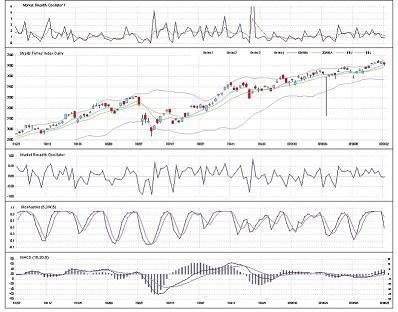
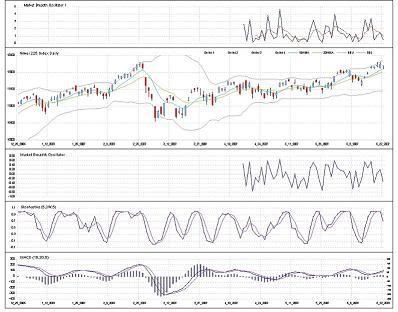
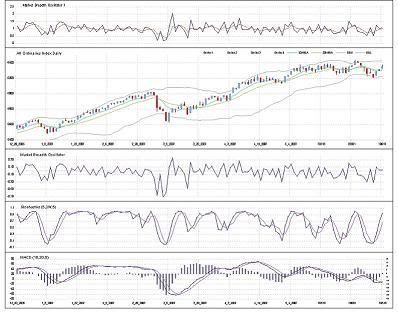
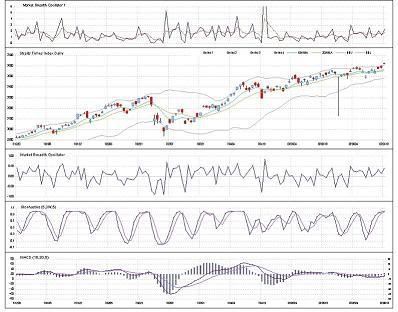
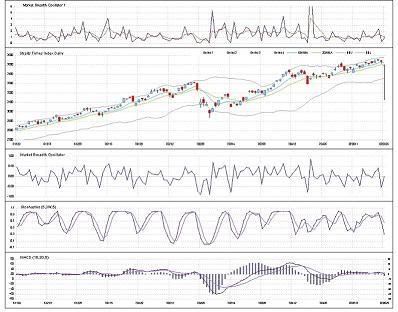
And yesterday (26/06/07), the Singapore Market played catch up with the US, falling by over 50 points to bring its stochastics to oversold level. The momentum player would be looking at the Hang Seng while the swing player would be looking at the STI and the All Ordinaries.


WEEKLY CHARTS:

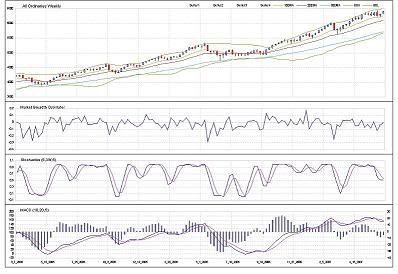
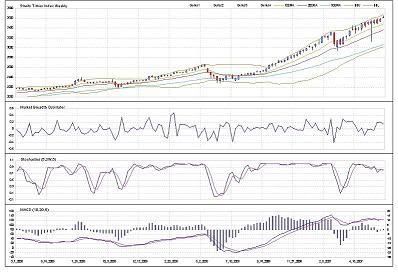
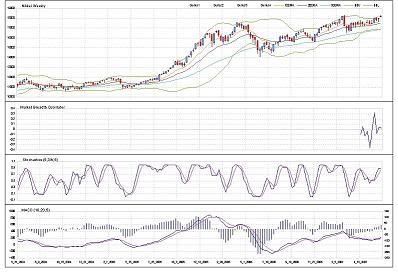
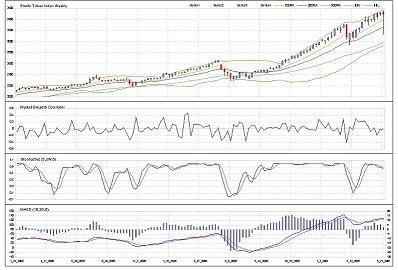
The Market Breadth and stochastics readings remain pretty varied among the indices but their uptrends are still dominant.


US MARKET COMMENTARY
--------------------------------------
Last week was pretty 'textbook' stuff. Rising oil price causing the market to fall. It's quite strange that somehow market events happen to support technical analysis expectations... or is it merely a case of "drawing the line, then plotting the points". I learnt the phrase from a macro-econ newsletter I read some time ago. That means that our financial journalist friends are digging for stories to explain why the market has moved in a certain way (after the market has moved). Good to know, but usually too late for profit.

One more month to the July earnings season, and I should probably start finding out what sort of numbers the analysts are churning out.


SHORT-TERM OUTLOOK
-----------------------------------

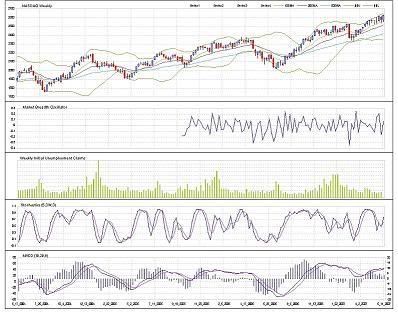
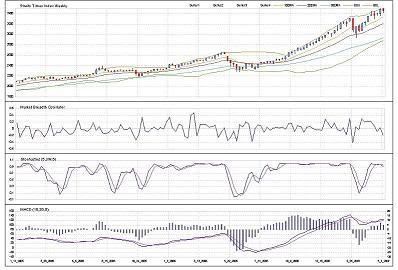
The NASDAQ index turned out almost the way I'd like it to. A doji and then another small ranging day, setting up three candles forming an ideal sell trigger below once the index breaks the 3-day low. And in textbook fashion, the selldown on Wednesday (20/06) did just that. The very low readings on the Volatility and PCR oscillators provided a pretty strong indication that a pull back would happen.

This coming week, would most likely see an upswing coming in now that short-term stochastics is hitting the oversold region and the market breadth oscillator is making a higher low. The ideal situation would be a doji, hammer or small ranging day on Monday (and even better if Tuesday as well), setting up a long trigger above the 2-day high.


MEDIUM-TERM OUTLOOK
--------------------------------------

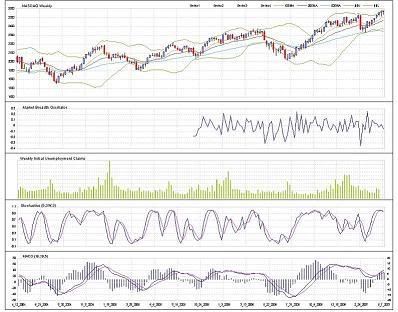
The uptrend is still intact, with the weekly market breadth oscillator at a low level, suggesting bullishness this week. How the medium term will turn out is still pretty iffy and more economic analysis is needed (havnt had the time to get around to that at the moment). Hopefully the economic data next week will provide more clues.


WHAT I'VE BEEN UP TO LATELY
----------------------------------------------------
No call from Macquarie Bank in the past week. But I'm still expecting a positive response.

Have also decided that I won't be extending my contract with BNP as a Fund Administrator as that's not what I'd like to do in the future. Sent an email to my recruitment consultant at Robert Walters and we'll see how it goes.

Have a gd week!

Monday, June 18, 2007

US & Asia Pacific Equity Markets Commentary 11 - 18 Jun 07

Hi all,

After 2 weeks of silence, I've found some time (and discipline) to post the commentary once again. The blog did not really have many visitors since May, which was one of the reasons for my laziness. It takes me a good 2-hours to post up the weekly commentaries and I'm not too sure if it has been helpful. The original plan was to provide a whole plethora of information - economical analaysis, technical analysis, fundamental analysis,...etc. But just technical commentary alone required two hours... and I haven't even gone into sectoral analysis yet!! I'm thinking of providing free stock scans, but that's still stuck in the pipeline... the data and computing capability are there, just have not found the time to write the program. But I'll probably get started on the Australian Stocks first since I'm looking for trading/dealing roles in Sydney and I need to show that I've done some work on the Australian market.

New additions: Finally, the daily chart for the Hang Seng Index is up (weekly to follow). The reason it took so long was because the data file provided by the Hong Kong Exchange is 3MB... and I didn't like the time it takes to download the data. But I've finally started to downloaded data (only 2007 at the moment) and plotted the Market Breadth Oscillator for the HKEX.


ASIA-PACIFIC MARKETS COMMENTARY
-------------------------------------------------------

DAILY CHARTS:

After the bond yields scare last week, all the indices rebounded nicely from the low on 13 Jun 07. I was at a recruitment agency for an interview for an online Trading Rep position and got home too late to place a trade for the Hang Seng warrants. It was a textbook setup.

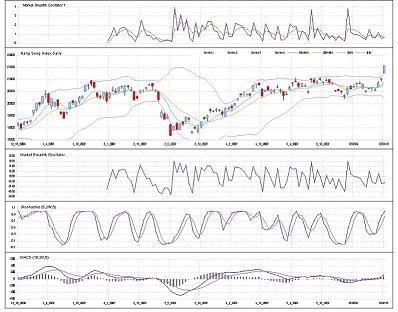
Going forward, the stochastics all look overbought to me. All except the All Ordinaries have broken out of their consolidation range. But all except the All Ords have moved outside of their upper Bollinger Bands. As usual, both a continued upmove or a reversal is just as likely. Trade with what the market tells you.

The Hang Seng Index is the only one with its Market Breadth Oscillator below '0' while the rest are pretty much in their upper ranges. Better to wait for them to fall to their lower ranges before going long.


WEEKLY CHARTS:

The Market Breadth readings are pretty varied among the indices. The STI in the high range, the Nikkei in the middle and the AORD just bouncing off its low. The AORD looks to be consolidating for 6 weeks now and is forming something that looks like a bull-flag. That's about all I can see from a technical point of view. I would advise the serious investor to condsider the fundamental and economic side of things to get a more complete picture.


US MARKET COMMENTARY
--------------------------------------
The markets recovered on lowered fears of inflation as the CPI came in unchanged after the interest rate scare last week. The markets seem to be getting more jittery now, reacting to the news pretty abruptly. Oil prices reached $68/barrel yesterday, and if it continues to stay high, the inflation scare is going to kick in again.

But the puzzling thing is why are the markets reacting to the long term bond yields pushing higher? The yield curve has become positive now because of it. Isn't a positive yield curve a good thing? I've downloaded and looked at the bond yields data back to 1990. To me, bond yields alone are not sufficient for market forecasting.

SHORT-TERM OUTLOOK
-----------------------------------

Like majority of the Asian Indices, the Nasdaq Index is also outside of its Bollinger Band. What has happened last Friday was not a very common occurence - gapping up and forming a doji. Volatility and PCR oscillators have fallen below '0' and are at possible reversal point. The Market Breadth Oscillator has also formed an up-down-up pattern that have led to down moves. Breaking it's 2-day low is an opportunity to go short - so if it forms a small candle on Monday, the setup will look alot better.


MEDIUM-TERM OUTLOOK
--------------------------------------

If things continue the way they are, the Nasdaq will remain strong until July. Historically, July is the time when the unemployment rate spikes up (for what reason I do not know... end of financial year perhaps). The second is that the Q2 earnings season will peak at the end of July, unveiling what the analysts think about their stocks for Q4.


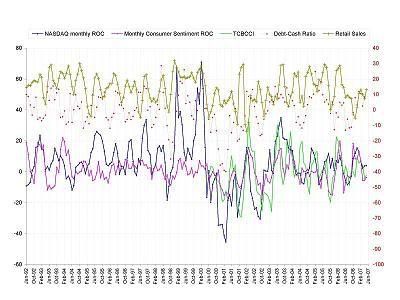
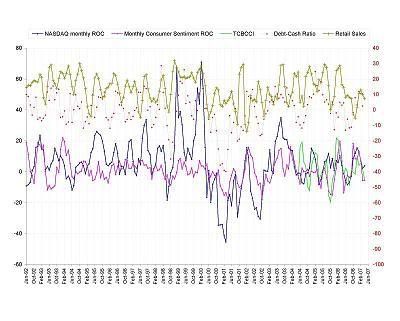
And yes, attached below is my trusty monthly indicators chart. I've added the Consumer Confidence Index (by The Conference Board, the same organisation that maintains the Leading, Coincident and Lagging indicators). I've plotted it with the Consumer Sentiment Index by Uni of Michigan. It's quite interesting to see how the two interact.

Basically, both the CSI and CCI have hit their lows and are starting to move up. The Nasdaq rate of change remains in positive territory while the retail sales increased in May 07. If retail sales move up again in June, I'd be more expectant of a market slowdown.


WHAT I'VE BEEN UP TO LATELY
----------------------------------------------------
I have been officially banned from working overtime. Today was the new head of unit registry's first day at work... when my manager introduced me as a contract worker, I was asked by the new boss if I will be renewing my contract... I couldn't answer, luckily he went on to meet the other team members.

Had 2 interviews last week. Besides the one for the Trading Rep position, I was at Macquarie Bank for an Assistant Dealer interview. I thought I did okay, answering all the questions they threw at me. I also believe that I had the most knowledge about the market among the four people they interviewed. God said "Let there be light", and I say "Let me get the job".... =)

Have a gd week!

Monday, May 28, 2007

SGX Insider and Substantial Shareholder transactions for 21 - 25 May 07 & Market Commentary

Hi all,

I've yet to download the SGX Insider and Substantial Shareholder transactions for the past week and will put them up together with next weeks commentary.


ASIA-PACIFIC MARKETS COMMENTARY
-------------------------------------------------------

DAILY CHARTS:

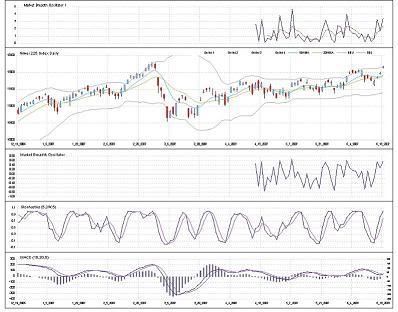
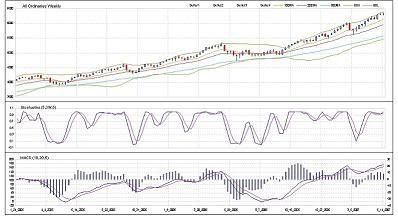
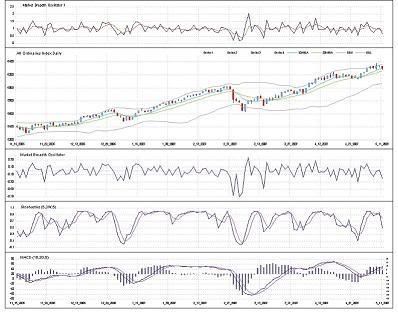
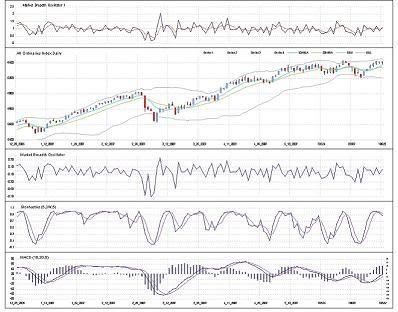
As mentioned last week, the All Ordinaries did finish higher on monday (21 May 07). The immediate resistance of 6377 was penetrated on an intraday basis last monday but has failed to move above it again. The index then moved sideways for the next two days before falling on Thursday, pushing the stochastics into oversold region. The market breadth line also suggests that there's room on the upside in the next one to two days. I would place my buy trigger at 6320 and short trigger below 6245.

The STI made new highs last Tuesday and Wednesday but only to fall on Thursday and Friday. The intraday low made last Friday was something to behold, falling past the 2-week low in one day and moving back up to close relatively unchanged. That shows that the market is quite skittish, with people rushing to sell to lock in their profits. The stochastics is now at oversold level but the market breadth line is at the other end. The ideal situation would be to wait for the market breadth line to fall and go long in anticipation of it moving up together with the stochastics.

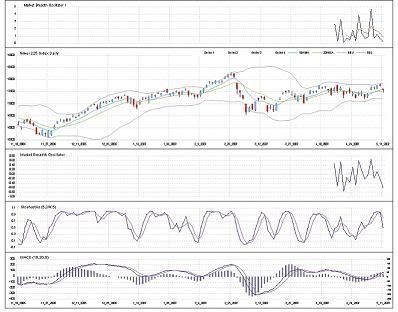
The Nikkei was almost the same last week - moving up on Monday and Tuesday, peaking on Wednesday and falling on Thursday and Friday. Going forward, the outlook of the Nikkei is the same as that of the Straits TImes Index - the possibility of a one or two day selldown and moving up after that.


WEEKLY CHARTS:

The the 2-week low of the indices remained unchanged on the weekly charts:
- All Ordinaries @ 6210 (2 week low not meaningful, using midpoint of 6290-6130 range)
- Nikkei 225 @ 17219
- Straits Times Index @ 3410

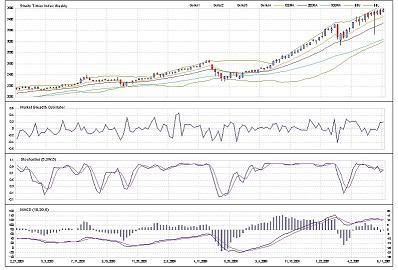
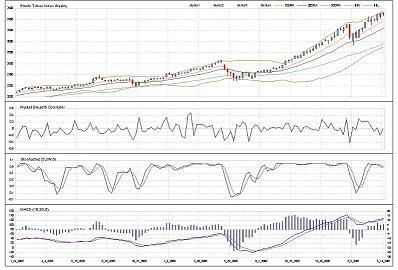
The Straits Times Index made a new high again last week, but closed lower. Weekly stochastics and MACD remains in high ground while the market breadth line remains in neutral territory. The long lower shadow suggests that the number of investors feeling fearful is on the rise.

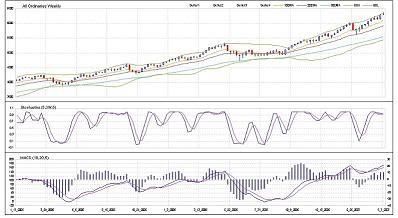
The All Ordinaries makes a lower low for the second consecutive week but remains above the 6210 mark. So it's not time to put on the bear cap yet.

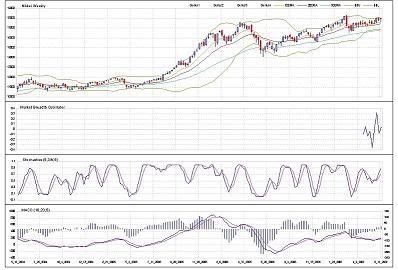
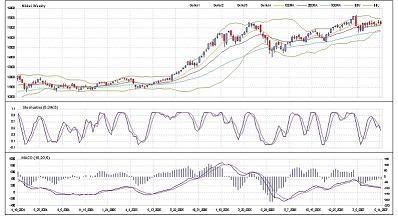
The Nikkei remains rangebound as its weekly stochastics continues to fall. The weekly Bollinger Bands remains narrow - just slightly above twice its average weekly range. The buy trigger for the Nikkei is 12830 - just above the consolidation range.


US MARKET COMMENTARY
--------------------------------------
It was a quiet week last week as far as release of economic data is concerned. Higher new home sales but lower existing home sales and higher crude inventories. Most of the data released are not known for their "market-moving" abilities.

SHORT-TERM OUTLOOK
-----------------------------------
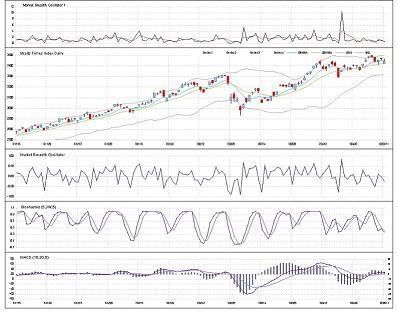
The NASDAQ composite fell last Wednesday and Thursday with an inside day on Friday. In japanese candlestick terminology, a harami has formed. But I would very much prefer to wait for a Harami-age (confirmation) before taking a position. Another reason being high market breadth readings while the stochastics is still going down does not show good returns.

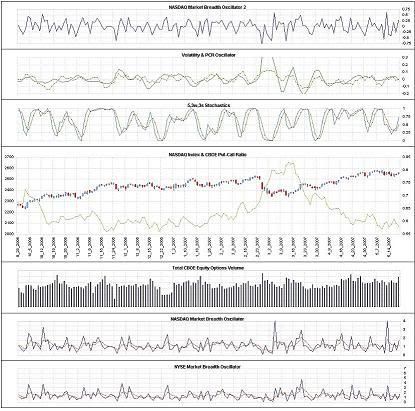
On the close of last friday, here's what the short-term indicators are telling us:

(1) NASDAQ Market Breath Oscillator 2

Bounced from a significant low last Thursday to a high on Friday.

(2) Volatility Oscillator

Looks like a short-term peak

(3) Put-Call Ratio Oscillator

Similar to the Volatility oscillator. Suggesting a possibilty of a short term bottom.

(4) Stochastics Oscillator

Coming down

(5) Put-Call Ratio EMA :

Low put buying

(6) CBOE Equity Options Volume :

Falling - low interest in put options.


MEDIUM-TERM OUTLOOK
--------------------------------------

Here's how the indicators are shaping up:
Market Breadth Oscillator: Historically high reading.
Stochastics: Moved below the 50% level.
MACD: %k slightly above %d

Contrary to last week's expectation of the market closing higher, it made a new high but closed slightly lower instead. A good reason to cash out when the gains look good. The bear trigger remains unchanged at 2150 and because of the high market breadth reading, I'm not expecting an all out bull rally this week.


WHAT I'VE BEEN UP TO LATELY
----------------------------------------------------
Worked another 45 hours - excluding luch and break times - last week... still very overloaded. Worked 11 hours on Friday without lunch. Take a look at my daily tasks and tell me if you can fit lunch inside

845-930
1) Run Funds-Under-Management report
2) Run Transactions report
3) Run Processed Applications report
4) Run Processed Redemptions report
5) Print and report bank statements

930-1000
1) Receive mail
2) Date and time stamp them
3) Count the number of applications, redemptions & maintenance
4) Enter the amount, dealer group and adviser for applications for 2 funds
5) Do up an email and attach all report files
6) Print out the reports and email to be checked by a senior
7) Make amendments to report(s) or email if necessary
8) Send out the email

1000-1130
1) Process the applications
i) check if investor exists
ii) enter cheque details on cheque banking coversheet
iii) print the coversheet
iv) photocopy the coversheet with each cheque and all application forms
v) attach the photocopy behind the application forms
vi) enter investor details, bank account details and distribution instructions
vii) terrorism and public figure check
viii) enter the trade (i.e. assigning units to the investor)
viv) print out investor audit report to be checked by another person
x) get senior to check if the trade was entered correctly
2) Process the redemptions
i) go into archive
ii) search for investor folder
iii) check if signature on redemption request is the same as on application form
iv) enter the redemption details into the system
v) get senior to check and confirm
3) Receive the 2nd batch of mail at 1130
i) date and time stamp them
ii) process the applications and redemptions
4) Receive the yields for the retail funds
5) Receive the prices for the wholesale funds
6) Receive faxes for wholesale applications and redemptions

1130-230
1) Process the yields
2) Update yield checklist report
3) Upload the prices
4) Process wholesale applications
5) Process wholesale redemptions
- All retail and wholesale redemptions must be finished by 215 tough luck if there's too many
6) Check amount for each redemption and exit fees
7) Check amount for each wholesale redemption received on previous day
8) Prepare emails to be sent at 230
i) Add up number and total amount of retail applications
ii) Investor number, amount and name of each redemption
iii) How much money to be transferred into the fund's operating account
iv) How much money to be transferred from fund's operating account for redemptions
v) How much money to be transferred from fund's operating account for wholesale redemptions
9) Continue to process retail and wholesale applications
10)Receive faxes for wholesale applications and redemptions

230-400
1) Run and print scheduled payments report
2) Prepare and print coversheet for payments report
3) Get team leader or manager to generate ABA file (for direct crediting of investors' account)
4) Ring Treasury and get them to print out the ABA
5) Go down to treasury to collect the ABA
6) Attach the ABA and get 2 seniors to sign the coversheet
7) Photocopy the lot
8) Bring down the originals back to treasury
9) Continue to process the retail and wholesale applications
10)Prepare email to sent at 4pm
i) add up total amount of wholesale applications received
ii) add up total amount of wholesale redemptions received
iii) add up total amount of wholesale redemptions received previous day
iv) print email
v) bring email and all relevant faxes to senior for checking

400-500
1) Generate letters for new investors
2) Generate letters for new investors' advisers
3) Generate letters for wholesale applications
4) Generate letters for wholesale redemptions
5) Go to print room, put in letterheads for the fund
6) Go back and print out all relevant letters
7) Print out fax cover sheets for all wholesale applications and redemptions
8) Fax the letters for wholesale applications and redemptions
9) Wait for confirmation that the faxes have been sent
10)Photocopy all letters
11)Fold and insert letters into envelopes
12)Collate the documents for filing and inclusion into daily tradepack

Now that you've seen my daily tasks, do you see the word "Lunch" anywhere?

These are just the daily tasks... I have not even included the phone calls, the emails, the peculiar requests, and also updating of investor details (e.g. change of address, change of adviser, etc etc etc).

On top of that, there are weekly Regular Savings Plans to process, fortnightly upfront commissions to advisers, monthly regular withdrawl instructions, monthly trail commissions to advisers and monthly fund distributions.

I think its about time to move.

Have a gd week!
Sunday, May 20, 2007

SGX Insider and Substantial Shareholder transactions for 14 - 18 May 07 & Market Commentary

Hi all,

I've yet to download the SGX Insider and Substantial Shareholder transactions for the past week and will put them up together with next weeks commentary.


ASIA-PACIFIC MARKETS COMMENTARY
-------------------------------------------------------

DAILY CHARTS:

For the past week, the All Ordinaries continues to move within the consolidation range between 6277 and 6377. The ASX market breadth line is again at short term reversal level and may well see the index finish higer this coming Monday (21 May 07). The Stochastics has crossed over to the upside. The immediate resistance is the top of the consolidation range at 6377. I would refer to the weekly chart to get an idea of the possibility of an upside breakout and the continuation of the rally.

The Straits Times Index was also "sort-of" rangebound except that it is somewhat positively inclined. The Market Breadth line is in neutral zone, which usually means that the prevailing trend is likely to continue. The reading on the stochastics is pretty high - something that I'm still trying to accept if I were to go long... I prefer to buy low stochastics readings.

The Nikkei 225 is the underperformer of the lot over these past few weeks. But I like how the indicators look here best. The Market Breadth line is low, and the stochastics is starting to turn over in oversold region. Although there is every possibility that the index can drift lower, the way the other regional indices are looking at the moment don't seem to suggest that happening - unless the All Ordinaries break down from the consolidation zone and the Straits Times index starts heading south. So Monday seems like an up day for the Japanese bourse.


WEEKLY CHARTS:

The the 2-week low of the indices have shifted on the weekly charts:
- All Ordinaries @ 6210 (2 week low not meaningful, using midpoint of 6290-6130 range)
- Nikkei 225 @ 17219
- Straits Times Index @ 3410

It was the Straits Times index's turn to make a new high last week; which is attributed (in my opinion) of the low weekly market breadth reading. The bullish undertone is still there and we may see it make another new high this coming week.

The All Ordinaries continue to look bullish and I've shifted the sell trigger upwards as seen above.

The Nikkei remains rangebound as its weekly stochastics continues to fall. The weekly Bollinger Bands are narrowing to just slightly above twice its average weekly range. The buy trigger for the Nikkei is 12830 - just above the consolidation range.


US MARKET COMMENTARY
--------------------------------------
The CPI for April fell 0.2% from its prior reading whike the Core CPI increased 0.1% of its prior reading. Economic reports showed that consumer spending is supported by low unemployment and the low US dollar. Capacity utilization remains relatively unchanged. The only unexpected data over the past week was the reading on the Conference Board's Leading Indicators Index; it came in significantly lower than prior reading and also lower than market consensus. Some digging needs to be done to determine the trend of the leading indicators to see if it is indeed turning down. If so, the US economy would most likely have well and truly peaked.

SHORT-TERM OUTLOOK
-----------------------------------
The NASDAQ composite bounced up from last Tuesday's low on low stochastics reading and market breadth levels. But Monday might see the index pause for a day or two before revealing where it wants to go.

On the close of last friday, here's what the short-term indicators are telling us:

(1) NASDAQ Market Breath Oscillator 2

Is now at a relatively high level after recovering from tuesday's low.

(2) Volatility Oscillator

Formed what looks to be a rounding top.

(3) Put-Call Ratio Oscillator

Similar to the Volatility oscillator. Suggesting a short term bottom (back on last tuesday)

(4) Stochastics Oscillator

Moving up

(5) Put-Call Ratio EMA :

Fluctuating at high call buying levels

(6) CBOE Equity Options Volume :

Moderate to heavy - interest in call options.


MEDIUM-TERM OUTLOOK
--------------------------------------

Here's how the indicators are shaping up:
Market Breadth Oscillator: Historically low reading.
Stochastics: Crossed to the downside.
MACD: %k remains above %d

A mixed reading this week, with the market breadth line at low level while the stochastics has made a downside crossover - a bearish suggestion. The bear cross on the stochastics will only be confirmed if the most recent low pivot (2150) is broken. And in the mean time, the coming week has a higher probabilty of finishing higher.


WHAT I'VE BEEN UP TO LATELY
----------------------------------------------------
Worked 45 hours last week... I was really overloaded. Things will probably not get better this coming week as a colleague (a guy from Ireland on a temp contract) just left on Friday to go to Melbourne - as part of his Australian tour - for a couple of months and find temp work while he's there. I guess that's the main difference between the young people in Singapore/Malaysia and the other countries. Young people from Korea, Japan, and all the other western countries leave their country in their early 20s to go travelling. Many of the Asians work as waiters/waitresses and shop assistants. I've yet to see them working as temps in the finance sector...probably that's because the temp roles are all taken by bachelor and master degree holders.... heheh. But with that said, working temp in Australia is better than working temp in Singapore, Malaysia, Indonesia.... etc... hands down.

Have a gd week!
Monday, May 14, 2007

SGX Insider and Substantial Shareholder transactions for 07 - 11 May 07 & Market Commentary

Hi all,

The raw data file significant Insider and Substantial Shareholders transactions reported on the Singapore Stock Exchange in the past week can be downloaded here (pls rename to .csv):
http://stocklogic.007ihost.com/SGX%20Change%20of%20Interest%2029%20Apr%20-%2004%20May%2007.html


ASIA-PACIFIC MARKETS COMMENTARY
-------------------------------------------------------

DAILY CHARTS:

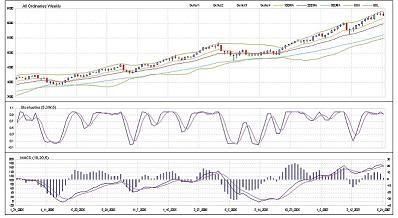
As of last friday, market breadth readings for both the ASX (Australian Stock Exchange) and the TSE (Tokyo Stock Exchange) are at levels where the markets have a high tendency to br up the next day (which is Monday - 14 May). Coupled that with a rally on the US side, finishing higher is almost a certainty. The only drawback is that the markets may gap at the opening and present no trading opportunity. With the benefit of hindsight, the Asia Pac markets did finish higher, with the Nikkei and the Stratis Times Index gapping on the open and traded in a narrow range for the day. The only index that presented an opportunity was the Australian All Ordinaries. You will not be able to see the candle formed today (14/5) because the snapshot was until last fridays close.

Many of the indices are moving sideways; and if the US finishes strong today (14/5), the AsiaPac markets would once again breakout on the upside.


WEEKLY CHARTS:

The the 2-week low of the indices have remained unchanged at these levels on the weekly charts:
- All Ordinaries @ 6140
- Nikkei 225 @ 17219
- Straits Times Index @ 3350

Only the All Ordinaries made a new high last week, while the other indices closed inside the range of the previous 2 weeks. The consolidation is most obvious for the Nikkei225. I would most likely go short once the low levels stated above for the indices are broken.


US MARKET COMMENTARY
--------------------------------------
The budget deficit for the US increased again; which I think would not be surprising to anyone by now. Budget deficits would probably have a more long term effect and would probably be more confined to the foreign currencies arena. Retail sales numbers (with or without automobile sales) for the month of April are down, confirming the weakened consumer confidence and sentiment numbers. Core PPI remained unchanged for April, but below the expectation of the market.


SHORT-TERM OUTLOOK
-----------------------------------
The NASDAQ composite fell by over 40 points last Thursday and recovered 28 on Friday. And with the market breadth at a significantly high level, I'm not expecting any big up move on Monday (14/5). But a close above the 2570 mark anytime within the week would mean that the bulls are still in control.

On the close of last friday, here's what the short-term indicators are telling us:

(1) NASDAQ Market Breath Oscillator 2

Shot up to a very high level in one day, and the oscillator would most likely be falling a bit this week, so I'm not expecting anything exciting (except on the downside) on the upside until it comes back down (nearer to or below zero)

(2) Volatility Oscillator

Still moving sideways near the zero line, not providing any forecasting value.

(3) Put-Call Ratio Oscillator

Fell to -0.1 suggesting the formation of a short term top which led to the decline on Thursday. Will need to move up to 0.1 for a buy signal (i.e. suggesting a short term bottom)

(4) Stochastics Oscillator

Is moving down, and may go either way. Price (or index value in this case) is still the ultimate determinant (simply because the stochastic is calculated using past index closing values.

(5) Put-Call Ratio EMA :

Has continued to move upwards (i.e. more put buying) despite the index recovering by 28 points on Friday. But it will most likely fall if the index starts to move higher.

(6) CBOE Equity Options Volume :

Falling - put buying not strong = crowd still bullish

2530 is the short-term short (trade) trigger and 2575 is the short-term long trigger.


MEDIUM-TERM OUTLOOK
--------------------------------------
The NASDAQ Composite made a new high last week but fell to close within the previous week's range.

Here's how the indicators are shaping up:
Market Breadth Oscillator: Fell again after rising for a week.
Stochastics: Still overbought
MACD: %k remains above %d

Although the index has gone up when this indicator is at this level in times past, but the overbought stochastics is causing some concern for me, which is causing me to have a slightly more bearish outlook in the coming weeks. How the index moves these few weeks may provide some indication of the state the market is in.

The 2-week low bear trigger remains unchanged at 2505. The reason why I use a 2-week low as a trigger is because the market can at times, take a few weeks to turn around. But the 2-week trigger level can remain even after 3,4 or 5 weeks down the road. This usually happens when a sideways consolidation starts to form.


MONTHLY INDICATORS CHART

I'm including the chart this week as well because I've included the data for Apr's Retail Sales. As mentioned last week, all the indicators except for the consumer confidence and sentiment are in no-man's land. The market can virtually go anywhere (although that's what it does all the time, but it's not providing any clues at the moment)


WHAT I'VE BEEN UP TO LATELY
----------------------------------------------------
Sometimes, I wonder if I should be commenting on the economic data when it's quite obvious that I use alot of technical analysis. The economic data are useful (to me) only if it has forcasting value. I am still working on my medium term analysis (i.e. the monthly economic data rate-of-change chart). That is the only part of my analysis that does not use technical analysis, but rather more of pattern recognition and using past market behaviour to locate extremes as entry points for medium term positions.

The number of visitors to this blog has also declined quite abit this month after setting a record high for April. Most visits are less than one minute anyway. So it seems like my plan of getting people to click my Google Ads are not working :)

I included alot of nonsense in the weekly commentary in the past because there's not much to write. But now that my functions for downloading and processing daily data for the AsiaPac indices are up and running, the commentary should start to get better, and the commentary + analysis more to the point because the readers will be able to see the charts themselves. I'm a very visual person by nature and I believe a picture tells a thousand words.... so more pictures, less words.

I'm abit tired of waiting for a good trading opportunity to present itself and am very tempted to just take a position... but I know that I'll probably lose money if I do that. Patience.

Have a gd week!