SGX Insider and Substantial Shareholder transactions for 23 - 27 Apr 07 & Market Commentary
Hi all,
The raw data file significant Insider and Substantial Shareholders transactions reported on the Singapore Stock Exchange in the past week can be downloaded here (pls rename to .csv):
http://stocklogic.007ihost.com/SGX%20Change%20of%20Interest%2023-27%20Apr%2007.html
I'm unable to sort out the file this week because of work commitments. It was actually my intention to use the data that I've been downloading to chart the trend of insider buying/selling for the Singapore market as well as for individual stocks. But the nature of which the transactions are filed makes it quite complicated to process by software, which is why I've sorted them out manually all this while.
ASIA-PACIFIC MARKETS COMMENTARY
-------------------------------------------------------
Last week was a quiet week, both on the news front as well as the technical front.
Last week's analysis called for a sideways or corrective move and things played out quite well. It was a week for short term traders.
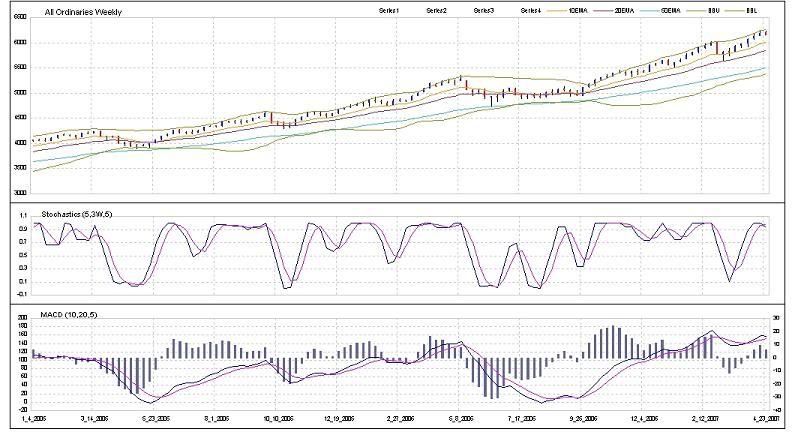
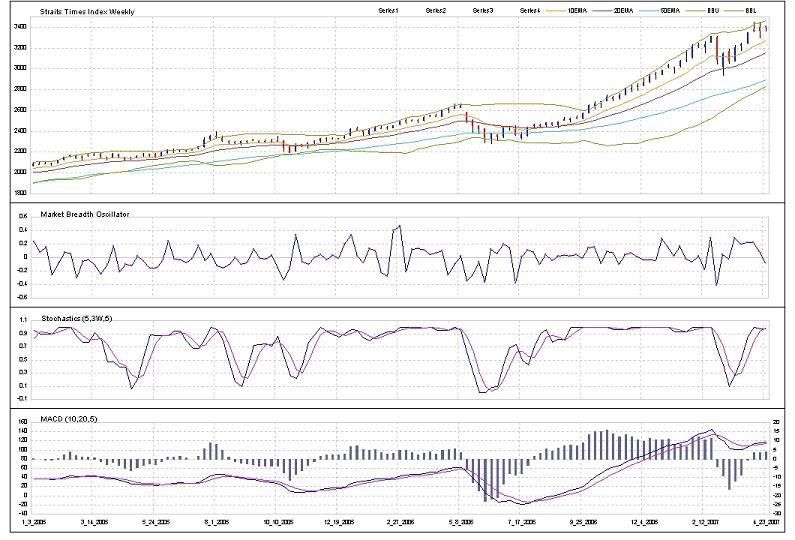
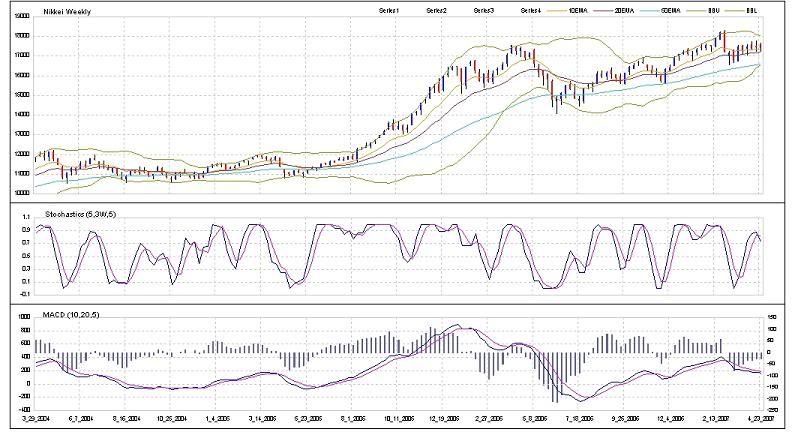
The All Ordinaries and the Nikkei 225 both fell more than the Straits Times Index and their stochastics have crossed over. The immediate support levels for these indices are as follows:
- All Ordinaries @ 6050
- Nikkei 225 @ 17219
- Straits Times Index @ 3290
The Market Breadth Oscillator for the Straits Times Index has declined for a third week in a row showing that the number of gainers is tapering off. This just shows that the market internals is weak, but the market may or may not correct. We'll just have to wait for confirmation.
Overall, the picture from the technical point of view remains unchanged - bearish, with the market still able to continue to move up at a very gradual pace. But things do look more bearish than last week.
I have started to record the daily market breadth data for the Tokyo Stock Exchange and hopefully I will be able to integrate it into the Nikkei chart next week (fingers crossed). Another thing that has been dragging for quite some time is the chart for the Hang Seng Index, and hopefully that will come soon.
US MARKET COMMENTARY
--------------------------------------
The economic data that came out over the past week were the COnsumer Confidence, COnsumer Sentiment, and the advanced reading for Q1 GDP. The GDP came in lower than last quarter as well as below expectations. Consumer Confidence was down while the COnsumer Sentiment increased slightly. In the next update, I will be showing my monthly indicators chart with the Consumer Confidence thrown in. So stay tuned.
SHORT-TERM OUTLOOK
-----------------------------------
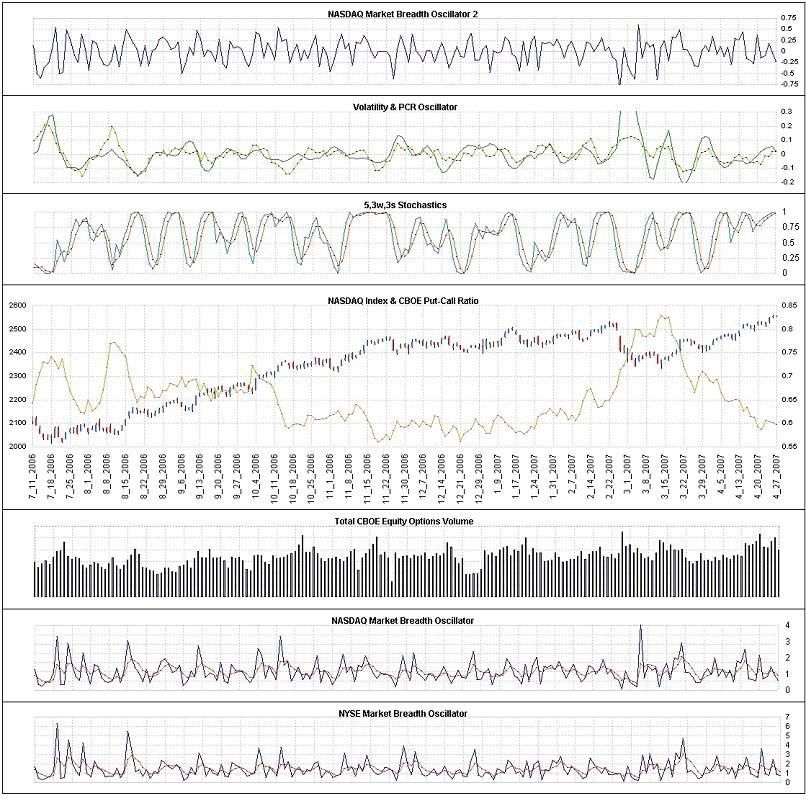
The Nasdaq Composite continued to move up while the Asia-Pacific markets lagged. Some of the indicators have started to show perculiarities.
On the close of last friday, here's what the short-term indicators are telling us:
(1) NASDAQ Market Breath Oscillator 2 : -0.22
(2) Volatility Oscillator : 0.038
(3) Put-Call Ration Oscillator : -0.01
(4) Stochastics Oscillator : Increased to >95%
(5) Put-Call Ration EMA : Very Slow Decline
(6) CBOE Equity Options Volume : Moderate
The MBO has started to fall but the index did not follow. A slight negative reading in oversold stochastics have a high probabiliy of the market coming down in a day or two.
The Volatility and PCR Oscillators are rising together with the index, something that has not been observed in the past 180 days and I have no idea why this is occurring.
The slow falling PCR suggests that the bulls might be losing steam. The PCR is also at historically low levels (high call buying).
So the outlook for the coming week suggests that a correction might materialise.
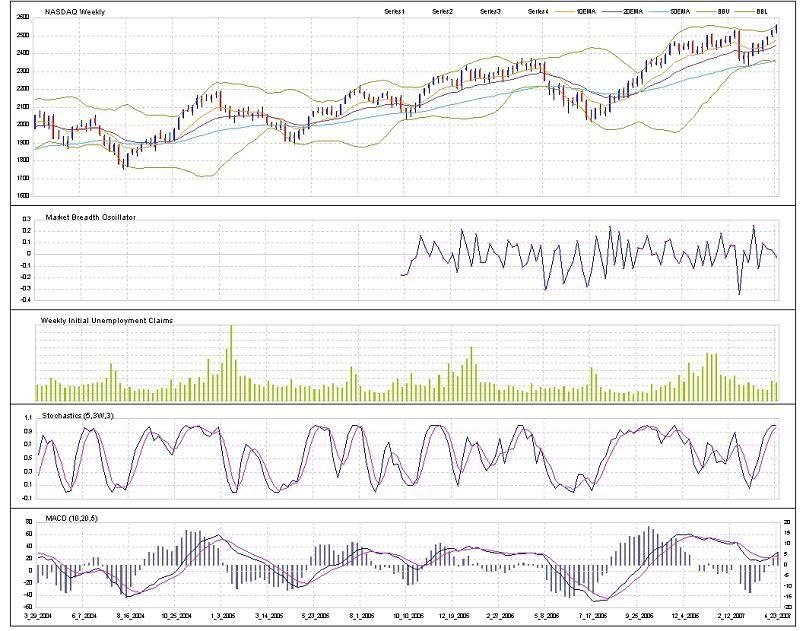
MEDIUM-TERM OUTLOOK
--------------------------------------
The Index closed up for another week, outperforming all other Asian Pacific markets. The index still looks strong but internals are showing signs of weakness.
Here's how the indicators are shaping up:
MBO: Fell to -0.024
Stochastics: Overbought, but starting to turn over
MACD: %k remains above %d
The decline of the MBO for third week running indicates that the market is losing breath. Couple that with stochastics that's starting to turn over, we are seeing some bearishness starting to come in.
The outlook remains unchanged although now somewhat more bearish but still with the possibility of trend continuation but with the likelihood of a top forming. I would say that a downtrend is underway once the index falls below 2490.
WHAT I'VE BEEN UP TO LATELY
----------------------------------------------------
Havn't been up to much over the past week except working, and keep thinking of new ways to look at the markets and how to increase my analysis accuracy.
Have a gd week!
posted by SmokingFlax @ 6:30 AM
0 comments
![]()

0 Comments:
Post a Comment
<< Home