SGX Insider and Substantial Shareholder transactions for 30 Apr - 04 May 07 & Market Commentary
Hi all,
The raw data file significant Insider and Substantial Shareholders transactions reported on the Singapore Stock Exchange in the past week can be downloaded here (pls rename to .csv):
http://stocklogic.007ihost.com/SGX%20Change%20of%20Interest%2029%20Apr%20-%2004%20May%2007.html
I think I'll probably leave the file unsorted for the time being until I find a way to automate the sorting process. This week, there were some download problems - probably too many people downloading the data from the server that they changed the html code a little.
ASIA-PACIFIC MARKETS COMMENTARY
-------------------------------------------------------
The markets rallied again in the last week after correcting for a day following in the footsteps of the US market.
So my view of a bearish market was not on the money since the correction only lasted a day. But that's how the market works... and that's the thing that keeps me on thinking, and continuing to finetune my analysis.
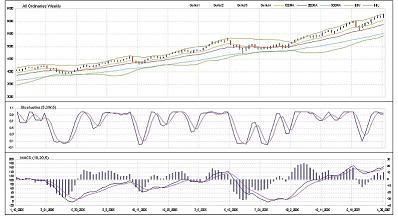
The Nikkei 225 remained almost unchanged for the week due to public holidays in Japan on the 3rd and 4th of May. The the 2-week low of the indices have now shifted up to these levels:
- All Ordinaries @ 6140
- Nikkei 225 @ 17219
- Straits Times Index @ 3350
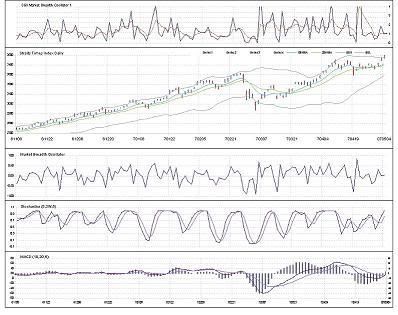
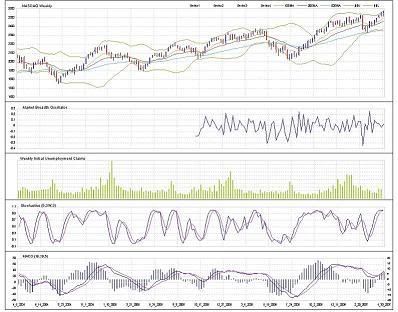
The Market Breadth Oscillator for the Straits Times Index recovered after three weeks of decline with the index making a nwe high. But as you can see on the SGX daily chart (this week's new addition), the stochastics have gone back up to extreme overbought level and the index has also closed outside the upper bollinger band. I'd expect the index to move sideways or correct slightly for a couple of days.
Since all the 2-week lows of the indices all remained intact, it seems like the bear is still hibernating.
US MARKET COMMENTARY
--------------------------------------
The more noteworthy economic data that came out over the past week were personal income, personal spending and the Chicago PMI. Personal income remained unchanged but personal spending fell below the previous reading as well as the market consensus; so it seems like consumers are still tightening their belts. The Chicago PMI also came in below previous reading and market consensus.
overall, the data that's been coming out over the past couple of weeks were not very pretty. Once the market confirms the data, maybe that's when a more substantial correction will set in.
SHORT-TERM OUTLOOK
-----------------------------------
The Nasdaq Composite corrected for a day before recovering to close somewhat unchanged for the week. Two spinning top candles were formed on thursday and friday. Spinning tops after a rally usually signal momentum loss.
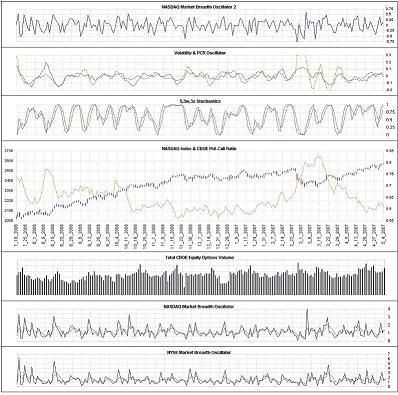
On the close of last friday, here's what the short-term indicators are telling us:
(1) NASDAQ Market Breath Oscillator 2 : 0.14
(2) Volatility Oscillator : -0.007
(3) Put-Call Ratio Oscillator : 0.02
(4) Stochastics Oscillator : over 95%
(5) Put-Call Ratio EMA : Fluctuating quite abit, but looks to be on the rise
(6) CBOE Equity Options Volume : Moderate
The MBO fell from the peak it made last wednesday.
The Volatility and PCR Oscillators are starting to look like the mid-Aug'06 to mid-Nov'06 period where the market advanced steadily, never correcting for more than two back-to-back days.
The slight rise in the average PCR indicates a slight pick up in put buying.
The two spinning tops and an oversold stochastics is making me suspicious about the index rallying strongly in the short term.
MEDIUM-TERM OUTLOOK
--------------------------------------
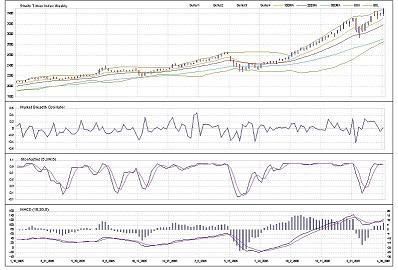
The Index closed up for another week, and not surprisingly, causing the weekly MBO to rise for the week.
Here's how the indicators are shaping up:
MBO: Rose to 0.227
Stochastics: Still overbought
MACD: %k remains above %d
The reason why I use a 2-week low as a trigger is because the market can at times, take a few weeks to turn around.
The outlook remains unchanged with the possibility of trend continuation but with the likelihood of a top forming. The 2-week low bear trigger has been shifted up to 2505.
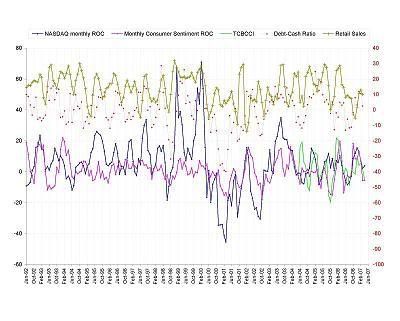
As promised, I've attached my Monthly Indicators chart this week and will probably do it on a monthly basis. As seen from the chart, both series for consumer sentiment (The Consumer Sentiment Index by the University of Michigan and the Consumer Confidence Index by the Conference Board) are below '0'and have seen market rallying in the next month (which is May'07 in this case)
The series for Retail Sales and the NYSE Debt-Cash ratio only have data up to Mar'07 and are in no-man's land.
WHAT I'VE BEEN UP TO LATELY
----------------------------------------------------
A colleague who's very experienced in the Unit Registry spent his last day in the team last friday and will be moving into fund accounting in another team. It's definitely a step forward for him. Also, Aberdeen will also cease to be a client soon, and have requested quite a few things to be done before they 'leave'. I was told that the relationship with Aberdeen went bad because of previous administrators made alot of errors. I wonder how they got the job in the first place.
Have a gd week!


0 Comments:
Post a Comment
<< Home