US & Asia Pacific Equity Markets Commentary 11 - 18 Jun 07
Hi all,
After 2 weeks of silence, I've found some time (and discipline) to post the commentary once again. The blog did not really have many visitors since May, which was one of the reasons for my laziness. It takes me a good 2-hours to post up the weekly commentaries and I'm not too sure if it has been helpful. The original plan was to provide a whole plethora of information - economical analaysis, technical analysis, fundamental analysis,...etc. But just technical commentary alone required two hours... and I haven't even gone into sectoral analysis yet!! I'm thinking of providing free stock scans, but that's still stuck in the pipeline... the data and computing capability are there, just have not found the time to write the program. But I'll probably get started on the Australian Stocks first since I'm looking for trading/dealing roles in Sydney and I need to show that I've done some work on the Australian market.
New additions: Finally, the daily chart for the Hang Seng Index is up (weekly to follow). The reason it took so long was because the data file provided by the Hong Kong Exchange is 3MB... and I didn't like the time it takes to download the data. But I've finally started to downloaded data (only 2007 at the moment) and plotted the Market Breadth Oscillator for the HKEX.
ASIA-PACIFIC MARKETS COMMENTARY
-------------------------------------------------------
DAILY CHARTS:
After the bond yields scare last week, all the indices rebounded nicely from the low on 13 Jun 07. I was at a recruitment agency for an interview for an online Trading Rep position and got home too late to place a trade for the Hang Seng warrants. It was a textbook setup.
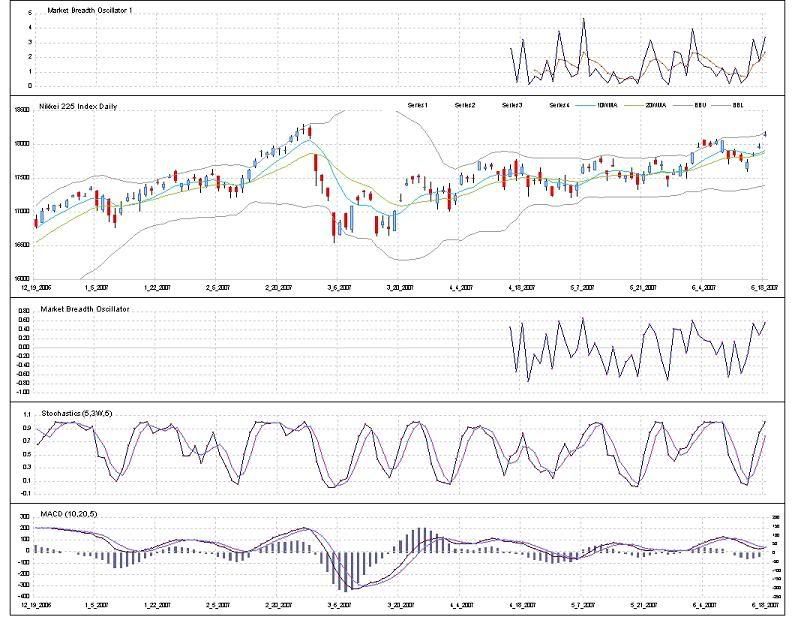
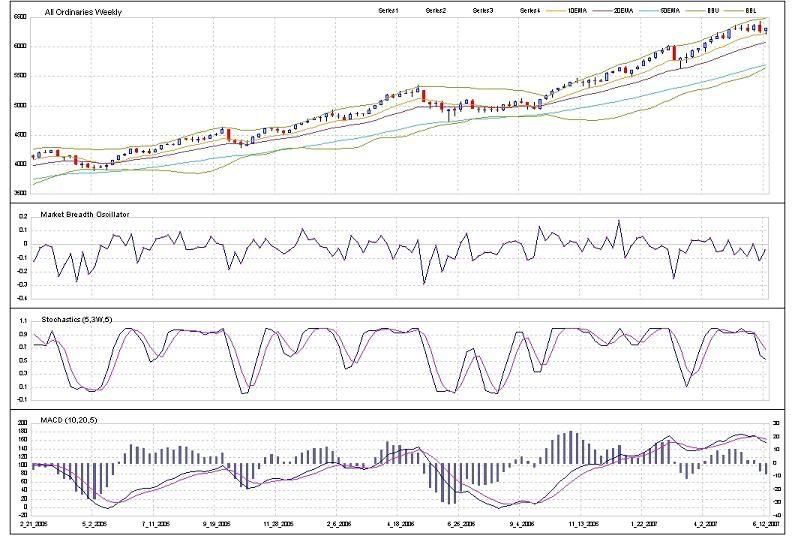
Going forward, the stochastics all look overbought to me. All except the All Ordinaries have broken out of their consolidation range. But all except the All Ords have moved outside of their upper Bollinger Bands. As usual, both a continued upmove or a reversal is just as likely. Trade with what the market tells you.
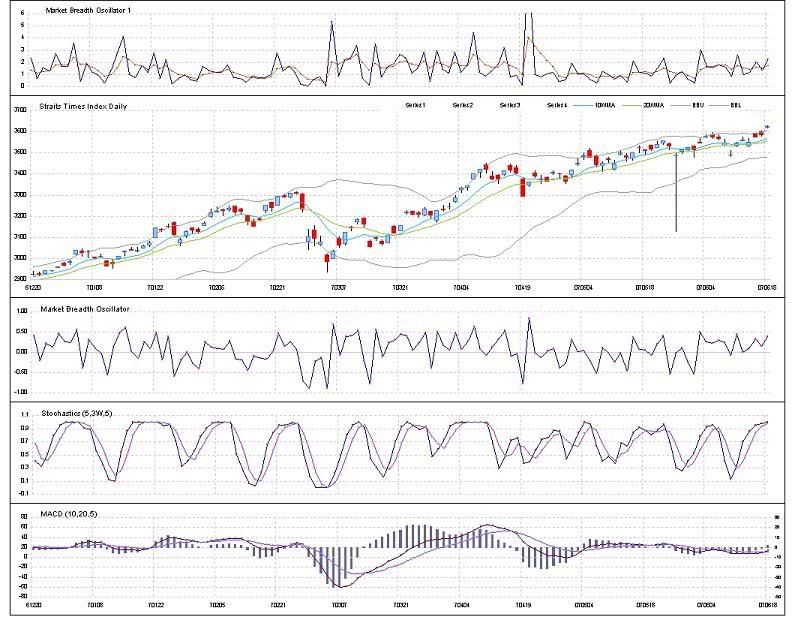
The Hang Seng Index is the only one with its Market Breadth Oscillator below '0' while the rest are pretty much in their upper ranges. Better to wait for them to fall to their lower ranges before going long.


WEEKLY CHARTS:
The Market Breadth readings are pretty varied among the indices. The STI in the high range, the Nikkei in the middle and the AORD just bouncing off its low. The AORD looks to be consolidating for 6 weeks now and is forming something that looks like a bull-flag. That's about all I can see from a technical point of view. I would advise the serious investor to condsider the fundamental and economic side of things to get a more complete picture.


US MARKET COMMENTARY
--------------------------------------
The markets recovered on lowered fears of inflation as the CPI came in unchanged after the interest rate scare last week. The markets seem to be getting more jittery now, reacting to the news pretty abruptly. Oil prices reached $68/barrel yesterday, and if it continues to stay high, the inflation scare is going to kick in again.
But the puzzling thing is why are the markets reacting to the long term bond yields pushing higher? The yield curve has become positive now because of it. Isn't a positive yield curve a good thing? I've downloaded and looked at the bond yields data back to 1990. To me, bond yields alone are not sufficient for market forecasting.
SHORT-TERM OUTLOOK
-----------------------------------
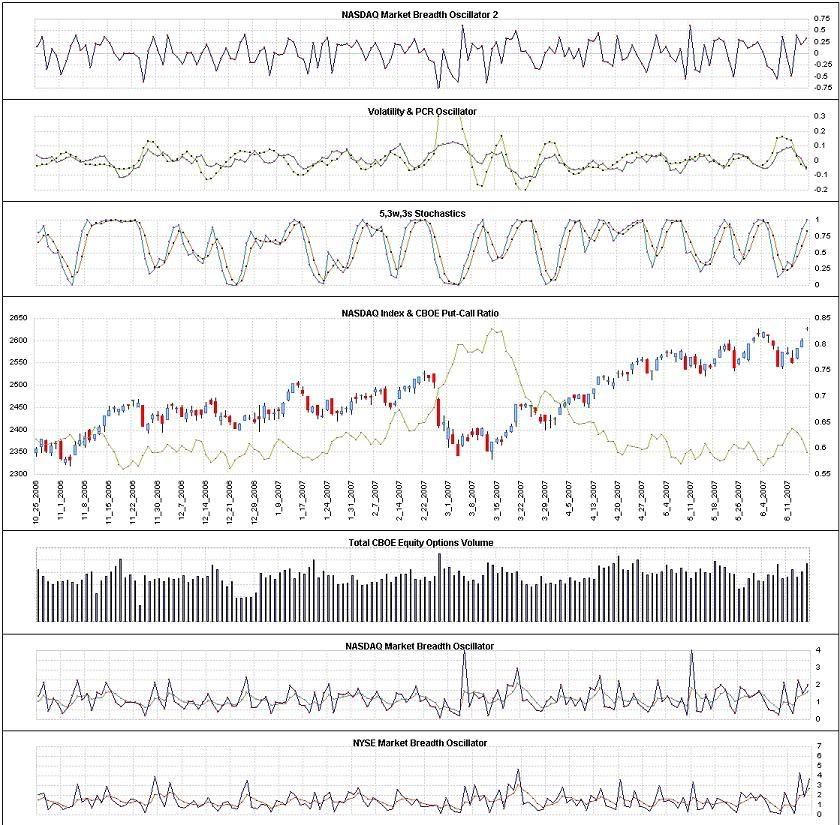
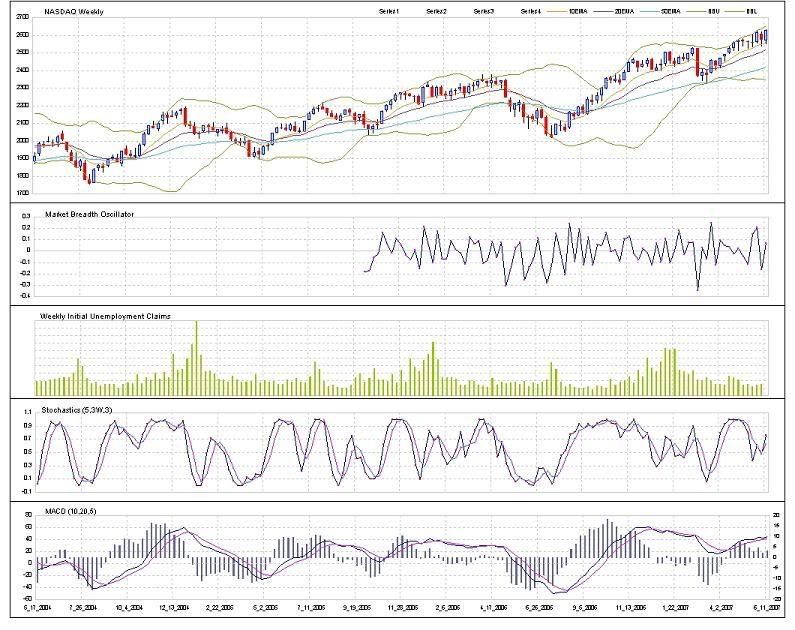
Like majority of the Asian Indices, the Nasdaq Index is also outside of its Bollinger Band. What has happened last Friday was not a very common occurence - gapping up and forming a doji. Volatility and PCR oscillators have fallen below '0' and are at possible reversal point. The Market Breadth Oscillator has also formed an up-down-up pattern that have led to down moves. Breaking it's 2-day low is an opportunity to go short - so if it forms a small candle on Monday, the setup will look alot better.
MEDIUM-TERM OUTLOOK
--------------------------------------
If things continue the way they are, the Nasdaq will remain strong until July. Historically, July is the time when the unemployment rate spikes up (for what reason I do not know... end of financial year perhaps). The second is that the Q2 earnings season will peak at the end of July, unveiling what the analysts think about their stocks for Q4.
And yes, attached below is my trusty monthly indicators chart. I've added the Consumer Confidence Index (by The Conference Board, the same organisation that maintains the Leading, Coincident and Lagging indicators). I've plotted it with the Consumer Sentiment Index by Uni of Michigan. It's quite interesting to see how the two interact.
Basically, both the CSI and CCI have hit their lows and are starting to move up. The Nasdaq rate of change remains in positive territory while the retail sales increased in May 07. If retail sales move up again in June, I'd be more expectant of a market slowdown.

WHAT I'VE BEEN UP TO LATELY
----------------------------------------------------
I have been officially banned from working overtime. Today was the new head of unit registry's first day at work... when my manager introduced me as a contract worker, I was asked by the new boss if I will be renewing my contract... I couldn't answer, luckily he went on to meet the other team members.
Had 2 interviews last week. Besides the one for the Trading Rep position, I was at Macquarie Bank for an Assistant Dealer interview. I thought I did okay, answering all the questions they threw at me. I also believe that I had the most knowledge about the market among the four people they interviewed. God said "Let there be light", and I say "Let me get the job".... =)
Have a gd week!
posted by SmokingFlax @ 6:36 AM
0 comments
![]()

0 Comments:
Post a Comment
<< Home