SGX Insider and Substantial Shareholder transactions for 07 - 11 May 07 & Market Commentary
Hi all,
The raw data file significant Insider and Substantial Shareholders transactions reported on the Singapore Stock Exchange in the past week can be downloaded here (pls rename to .csv):
http://stocklogic.007ihost.com/SGX%20Change%20of%20Interest%2029%20Apr%20-%2004%20May%2007.html
ASIA-PACIFIC MARKETS COMMENTARY
-------------------------------------------------------
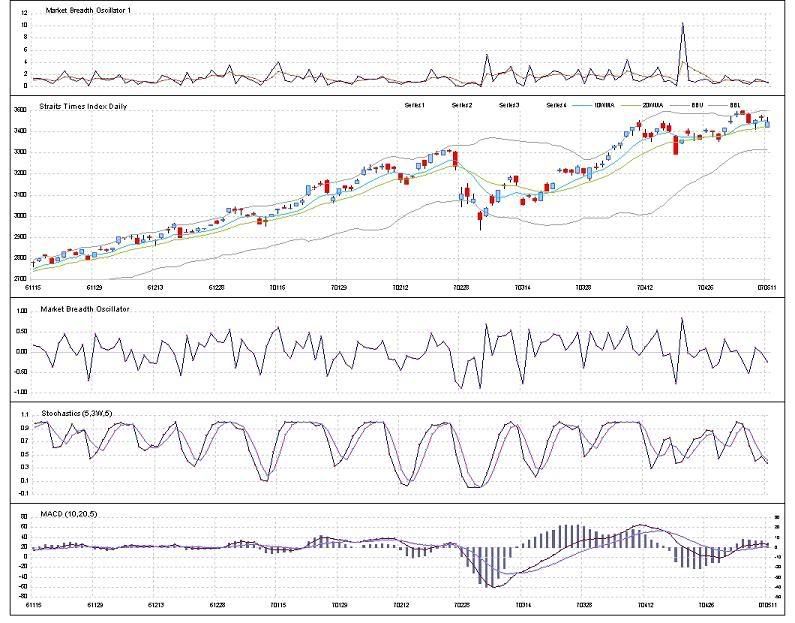
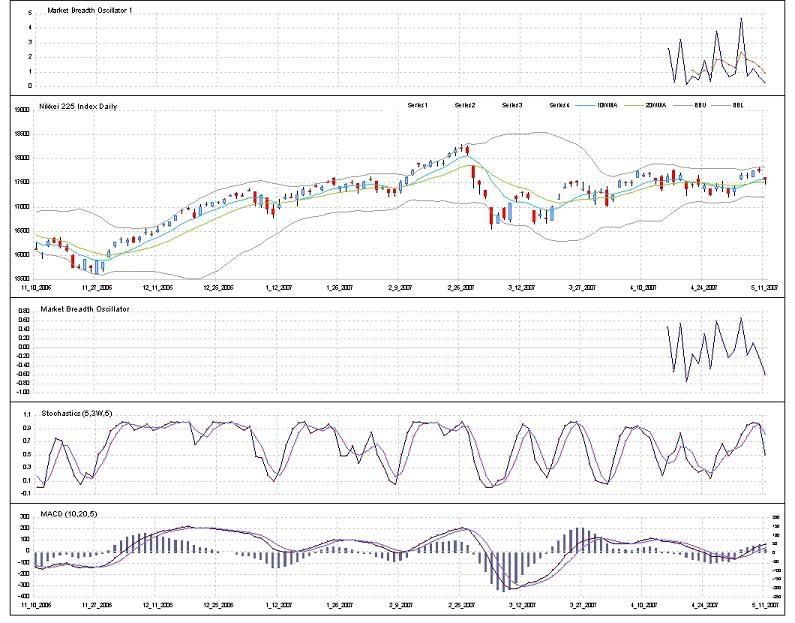
DAILY CHARTS:
As of last friday, market breadth readings for both the ASX (Australian Stock Exchange) and the TSE (Tokyo Stock Exchange) are at levels where the markets have a high tendency to br up the next day (which is Monday - 14 May). Coupled that with a rally on the US side, finishing higher is almost a certainty. The only drawback is that the markets may gap at the opening and present no trading opportunity. With the benefit of hindsight, the Asia Pac markets did finish higher, with the Nikkei and the Stratis Times Index gapping on the open and traded in a narrow range for the day. The only index that presented an opportunity was the Australian All Ordinaries. You will not be able to see the candle formed today (14/5) because the snapshot was until last fridays close.
Many of the indices are moving sideways; and if the US finishes strong today (14/5), the AsiaPac markets would once again breakout on the upside.

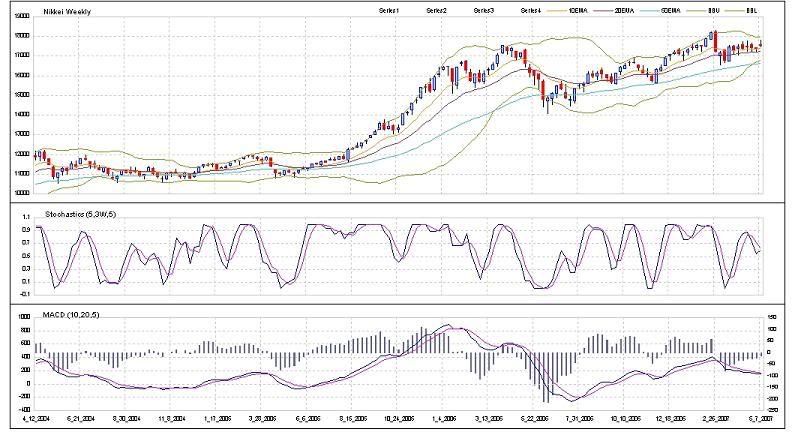
WEEKLY CHARTS:
The the 2-week low of the indices have remained unchanged at these levels on the weekly charts:
- All Ordinaries @ 6140
- Nikkei 225 @ 17219
- Straits Times Index @ 3350
Only the All Ordinaries made a new high last week, while the other indices closed inside the range of the previous 2 weeks. The consolidation is most obvious for the Nikkei225. I would most likely go short once the low levels stated above for the indices are broken.


US MARKET COMMENTARY
--------------------------------------
The budget deficit for the US increased again; which I think would not be surprising to anyone by now. Budget deficits would probably have a more long term effect and would probably be more confined to the foreign currencies arena. Retail sales numbers (with or without automobile sales) for the month of April are down, confirming the weakened consumer confidence and sentiment numbers. Core PPI remained unchanged for April, but below the expectation of the market.
SHORT-TERM OUTLOOK
-----------------------------------
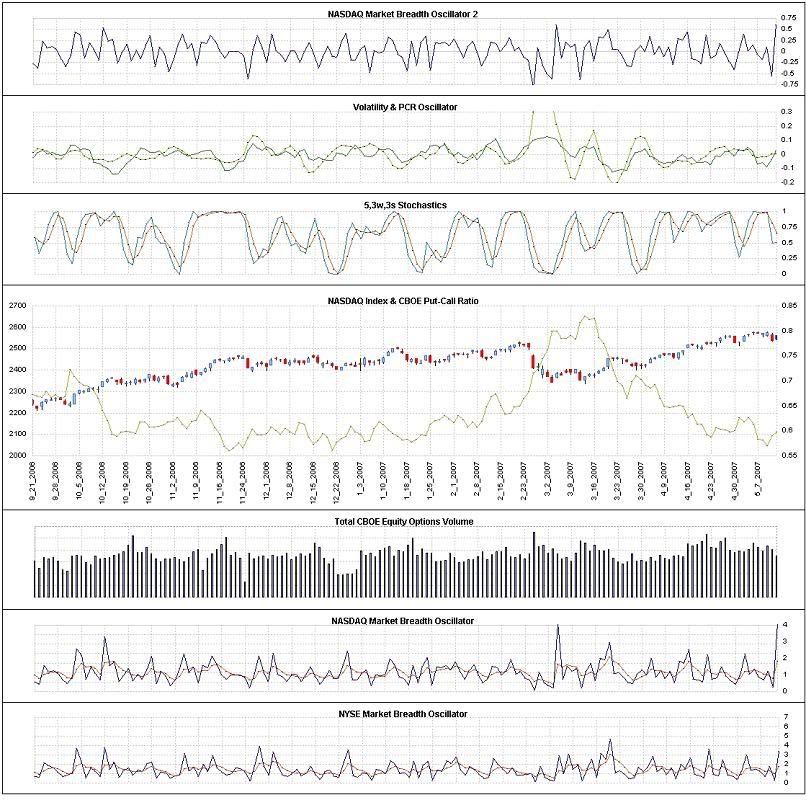
The NASDAQ composite fell by over 40 points last Thursday and recovered 28 on Friday. And with the market breadth at a significantly high level, I'm not expecting any big up move on Monday (14/5). But a close above the 2570 mark anytime within the week would mean that the bulls are still in control.
On the close of last friday, here's what the short-term indicators are telling us:
(1) NASDAQ Market Breath Oscillator 2
Shot up to a very high level in one day, and the oscillator would most likely be falling a bit this week, so I'm not expecting anything exciting (except on the downside) on the upside until it comes back down (nearer to or below zero)
(2) Volatility Oscillator
Still moving sideways near the zero line, not providing any forecasting value.
(3) Put-Call Ratio Oscillator
Fell to -0.1 suggesting the formation of a short term top which led to the decline on Thursday. Will need to move up to 0.1 for a buy signal (i.e. suggesting a short term bottom)
(4) Stochastics Oscillator
Is moving down, and may go either way. Price (or index value in this case) is still the ultimate determinant (simply because the stochastic is calculated using past index closing values.
(5) Put-Call Ratio EMA :
Has continued to move upwards (i.e. more put buying) despite the index recovering by 28 points on Friday. But it will most likely fall if the index starts to move higher.
(6) CBOE Equity Options Volume :
Falling - put buying not strong = crowd still bullish
2530 is the short-term short (trade) trigger and 2575 is the short-term long trigger.
MEDIUM-TERM OUTLOOK
--------------------------------------
The NASDAQ Composite made a new high last week but fell to close within the previous week's range.
Here's how the indicators are shaping up:
Market Breadth Oscillator: Fell again after rising for a week.
Stochastics: Still overbought
MACD: %k remains above %d
Although the index has gone up when this indicator is at this level in times past, but the overbought stochastics is causing some concern for me, which is causing me to have a slightly more bearish outlook in the coming weeks. How the index moves these few weeks may provide some indication of the state the market is in.
The 2-week low bear trigger remains unchanged at 2505. The reason why I use a 2-week low as a trigger is because the market can at times, take a few weeks to turn around. But the 2-week trigger level can remain even after 3,4 or 5 weeks down the road. This usually happens when a sideways consolidation starts to form.

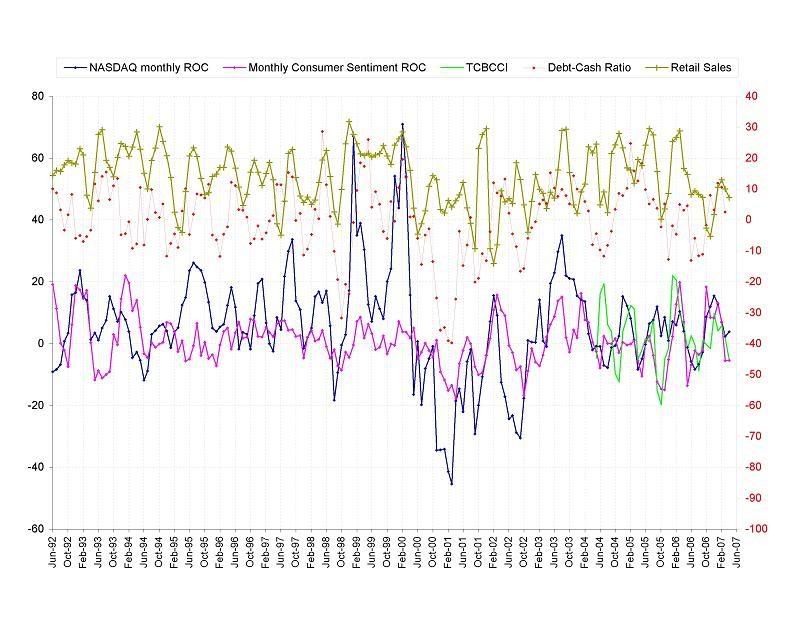
MONTHLY INDICATORS CHART
I'm including the chart this week as well because I've included the data for Apr's Retail Sales. As mentioned last week, all the indicators except for the consumer confidence and sentiment are in no-man's land. The market can virtually go anywhere (although that's what it does all the time, but it's not providing any clues at the moment)
WHAT I'VE BEEN UP TO LATELY
----------------------------------------------------
Sometimes, I wonder if I should be commenting on the economic data when it's quite obvious that I use alot of technical analysis. The economic data are useful (to me) only if it has forcasting value. I am still working on my medium term analysis (i.e. the monthly economic data rate-of-change chart). That is the only part of my analysis that does not use technical analysis, but rather more of pattern recognition and using past market behaviour to locate extremes as entry points for medium term positions.
The number of visitors to this blog has also declined quite abit this month after setting a record high for April. Most visits are less than one minute anyway. So it seems like my plan of getting people to click my Google Ads are not working :)
I included alot of nonsense in the weekly commentary in the past because there's not much to write. But now that my functions for downloading and processing daily data for the AsiaPac indices are up and running, the commentary should start to get better, and the commentary + analysis more to the point because the readers will be able to see the charts themselves. I'm a very visual person by nature and I believe a picture tells a thousand words.... so more pictures, less words.
I'm abit tired of waiting for a good trading opportunity to present itself and am very tempted to just take a position... but I know that I'll probably lose money if I do that. Patience.
Have a gd week!
posted by SmokingFlax @ 6:23 AM
0 comments
![]()

0 Comments:
Post a Comment
<< Home