SGX Insider and Substantial Shareholder transactions for 21 - 25 May 07 & Market Commentary
Hi all,
I've yet to download the SGX Insider and Substantial Shareholder transactions for the past week and will put them up together with next weeks commentary.
ASIA-PACIFIC MARKETS COMMENTARY
-------------------------------------------------------
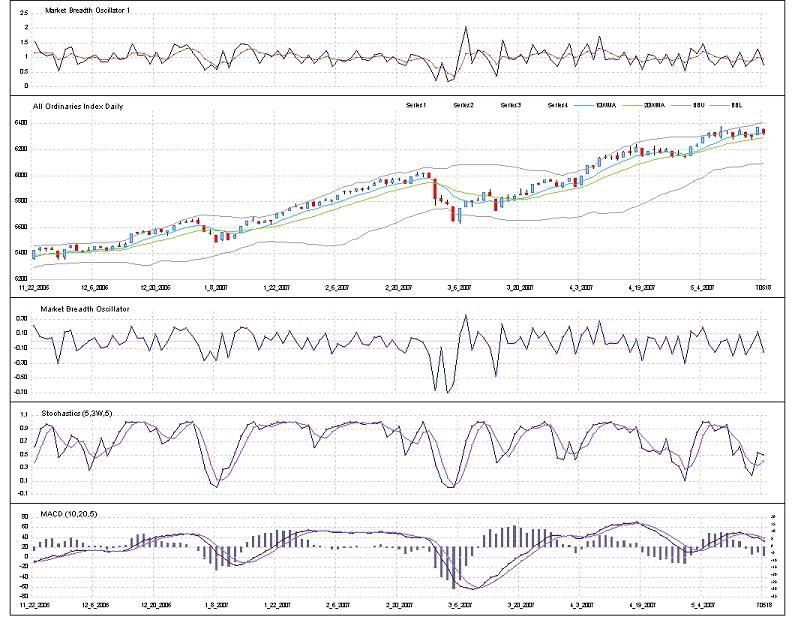
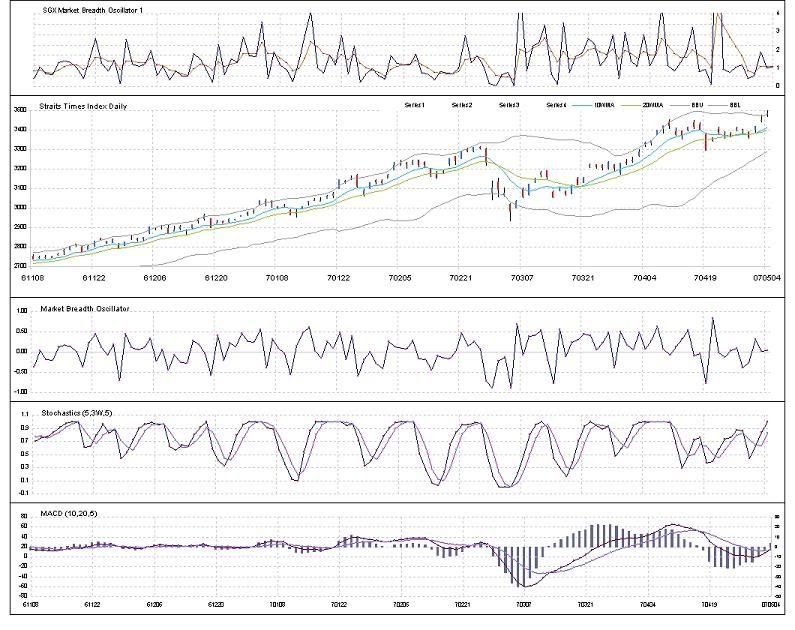
DAILY CHARTS:
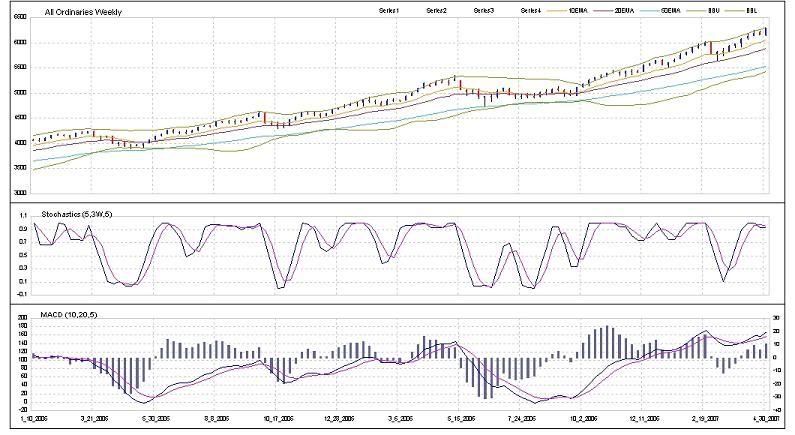
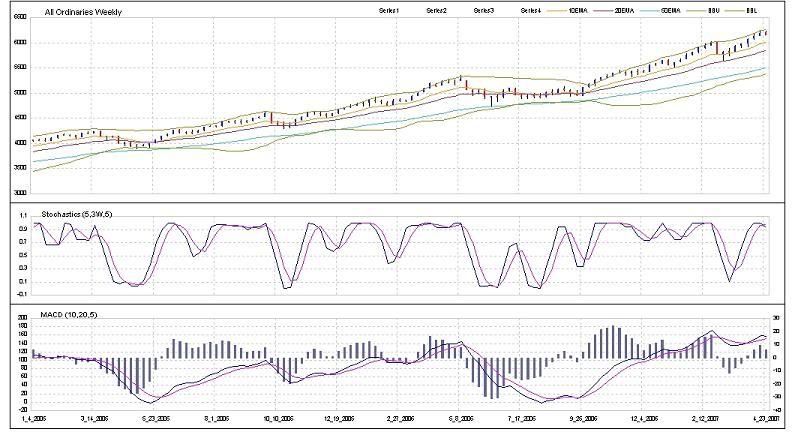
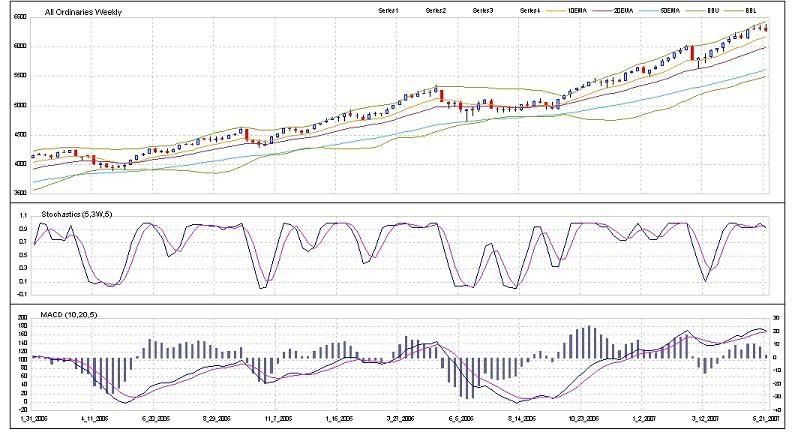
As mentioned last week, the All Ordinaries did finish higher on monday (21 May 07). The immediate resistance of 6377 was penetrated on an intraday basis last monday but has failed to move above it again. The index then moved sideways for the next two days before falling on Thursday, pushing the stochastics into oversold region. The market breadth line also suggests that there's room on the upside in the next one to two days. I would place my buy trigger at 6320 and short trigger below 6245.
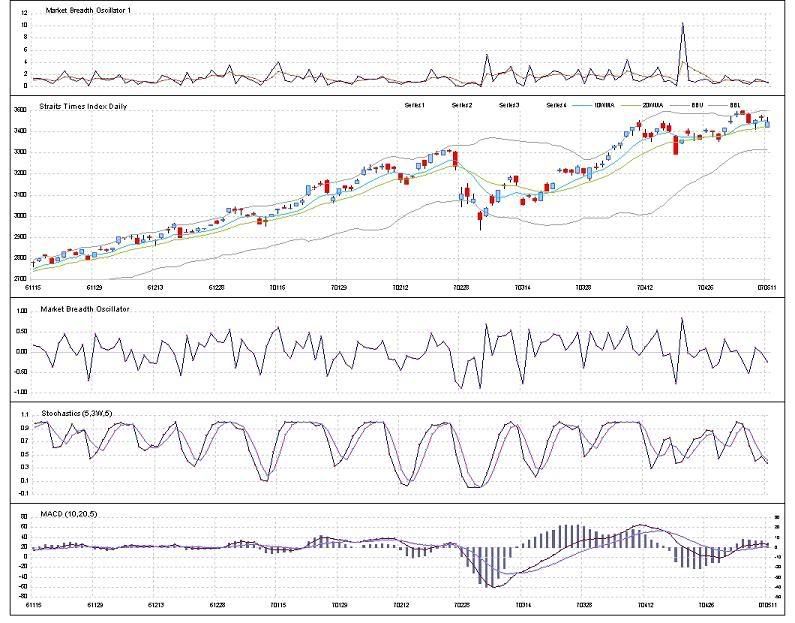
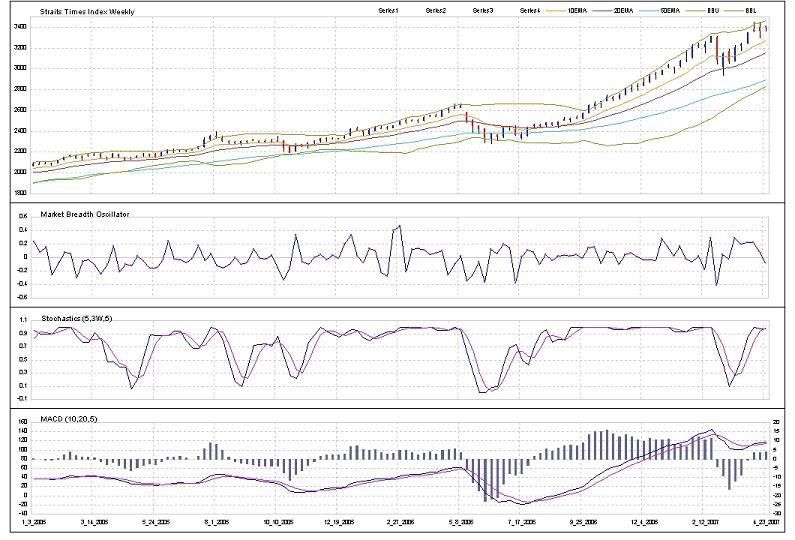
The STI made new highs last Tuesday and Wednesday but only to fall on Thursday and Friday. The intraday low made last Friday was something to behold, falling past the 2-week low in one day and moving back up to close relatively unchanged. That shows that the market is quite skittish, with people rushing to sell to lock in their profits. The stochastics is now at oversold level but the market breadth line is at the other end. The ideal situation would be to wait for the market breadth line to fall and go long in anticipation of it moving up together with the stochastics.
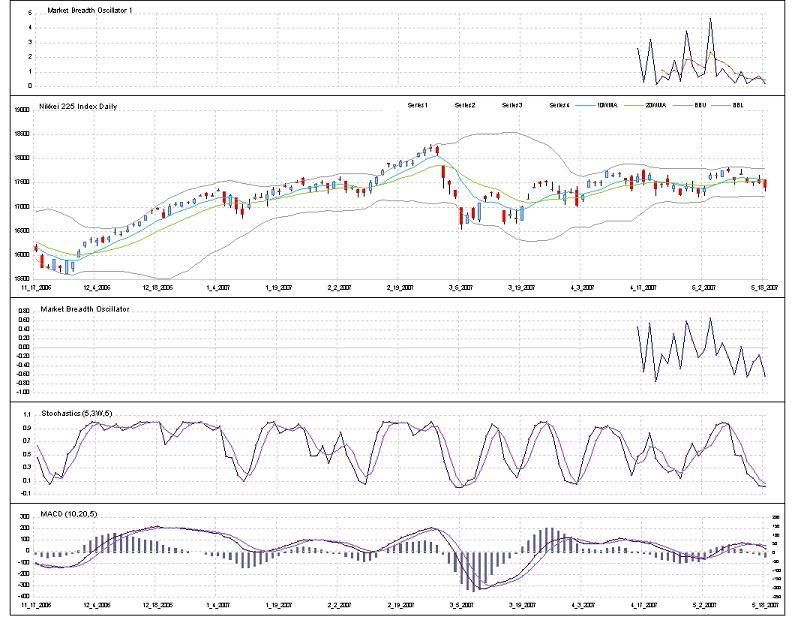
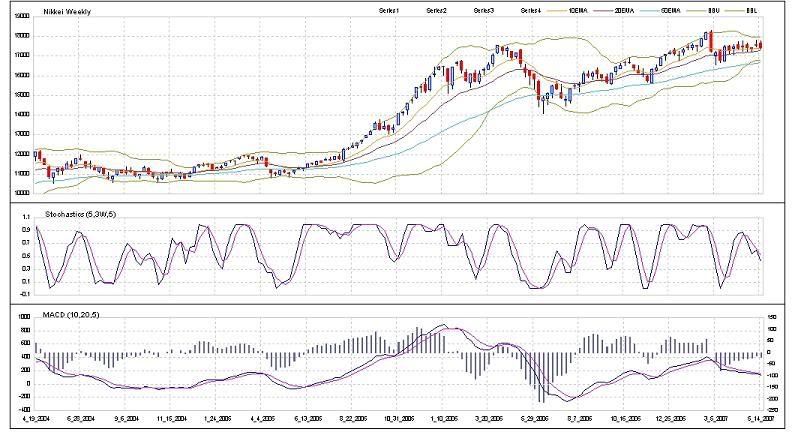
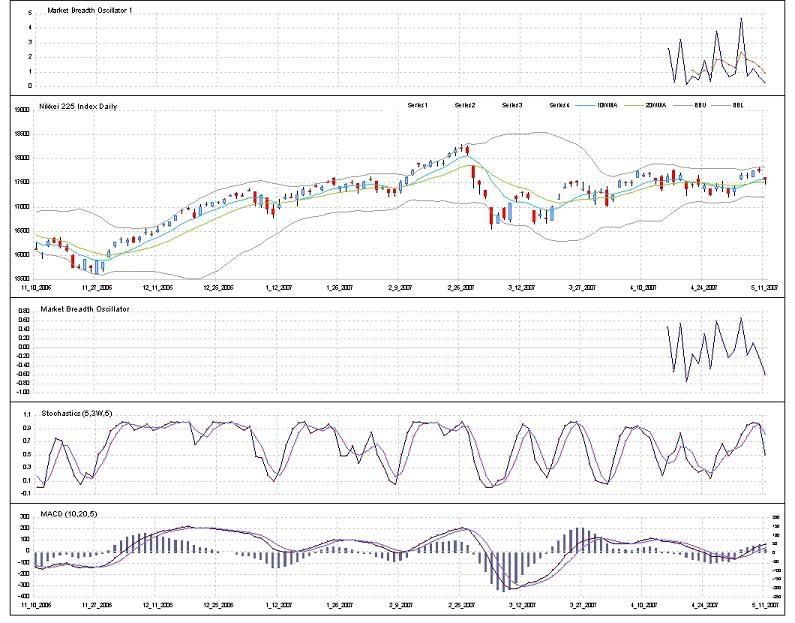
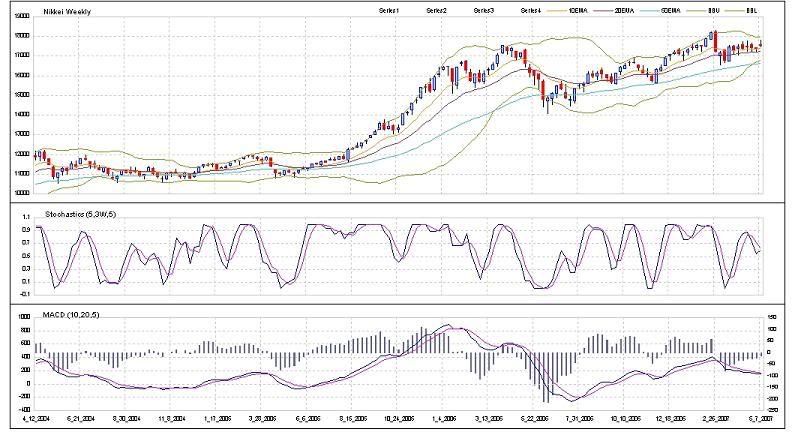
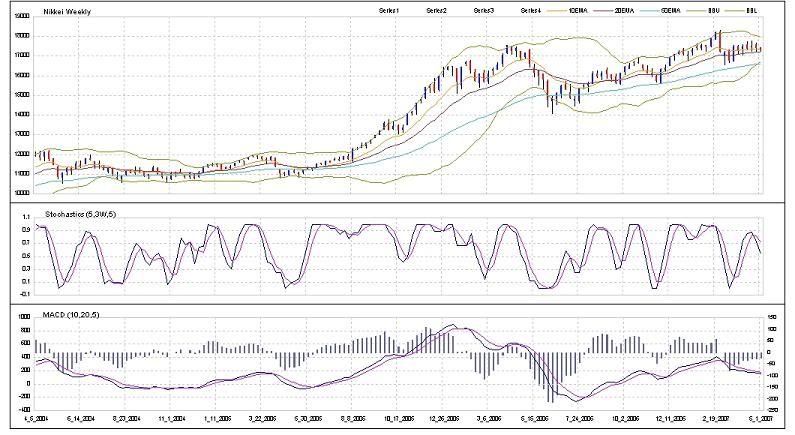
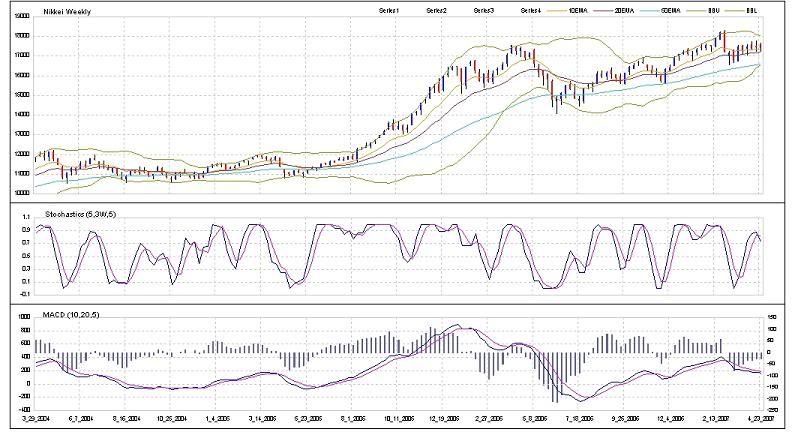
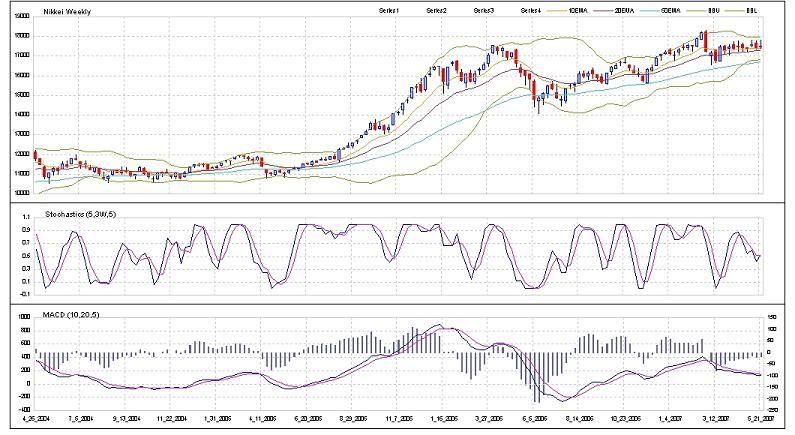
The Nikkei was almost the same last week - moving up on Monday and Tuesday, peaking on Wednesday and falling on Thursday and Friday. Going forward, the outlook of the Nikkei is the same as that of the Straits TImes Index - the possibility of a one or two day selldown and moving up after that.


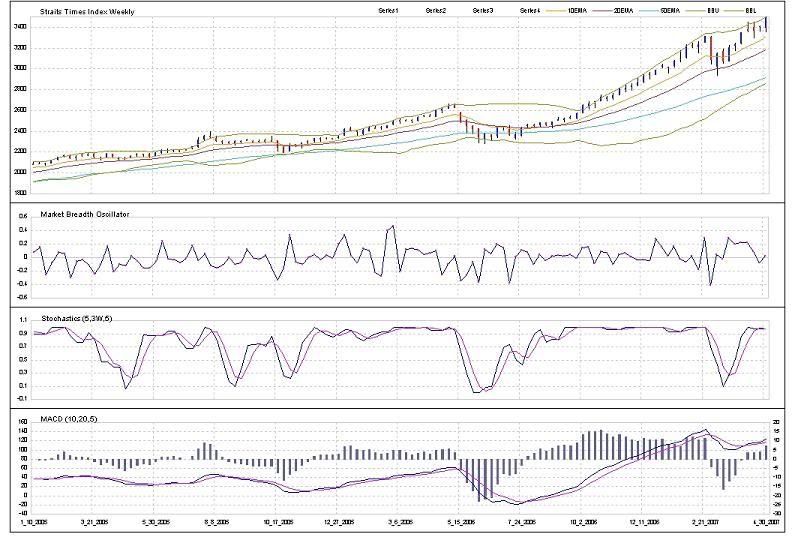
WEEKLY CHARTS:
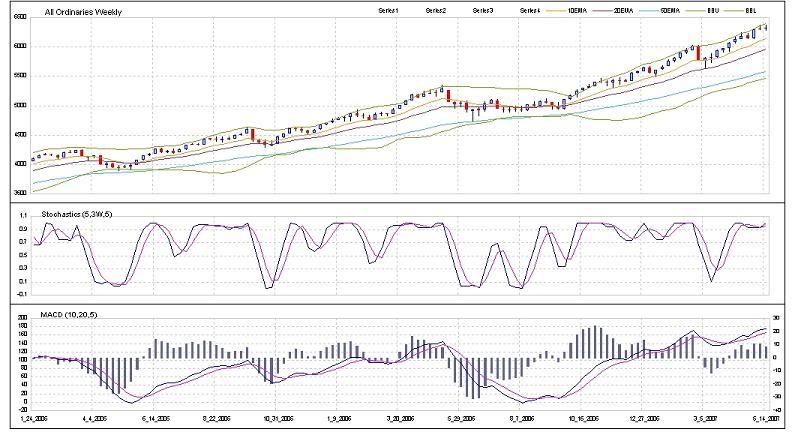
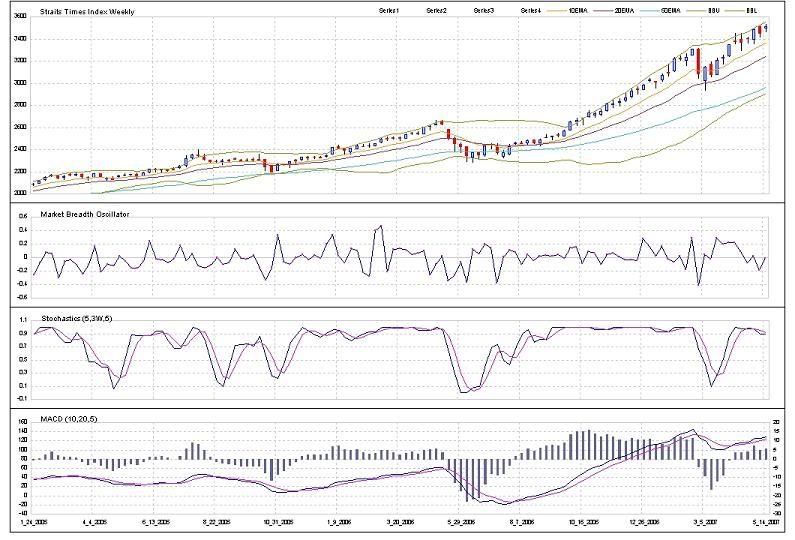
The the 2-week low of the indices remained unchanged on the weekly charts:
- All Ordinaries @ 6210 (2 week low not meaningful, using midpoint of 6290-6130 range)
- Nikkei 225 @ 17219
- Straits Times Index @ 3410
The Straits Times Index made a new high again last week, but closed lower. Weekly stochastics and MACD remains in high ground while the market breadth line remains in neutral territory. The long lower shadow suggests that the number of investors feeling fearful is on the rise.
The All Ordinaries makes a lower low for the second consecutive week but remains above the 6210 mark. So it's not time to put on the bear cap yet.
The Nikkei remains rangebound as its weekly stochastics continues to fall. The weekly Bollinger Bands remains narrow - just slightly above twice its average weekly range. The buy trigger for the Nikkei is 12830 - just above the consolidation range.

US MARKET COMMENTARY
--------------------------------------
It was a quiet week last week as far as release of economic data is concerned. Higher new home sales but lower existing home sales and higher crude inventories. Most of the data released are not known for their "market-moving" abilities.
SHORT-TERM OUTLOOK
-----------------------------------
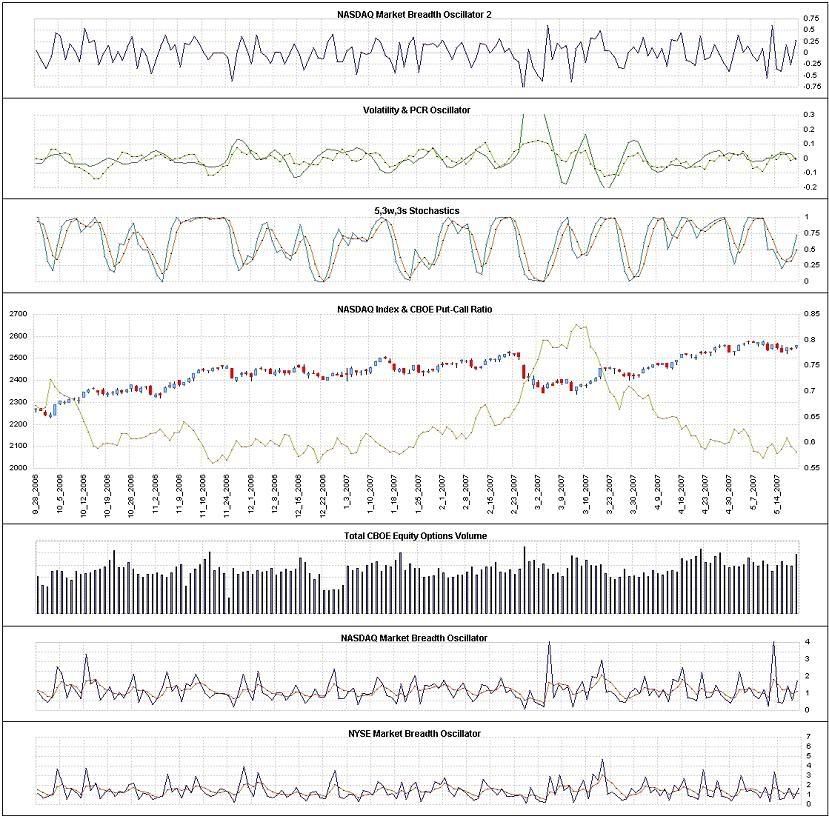
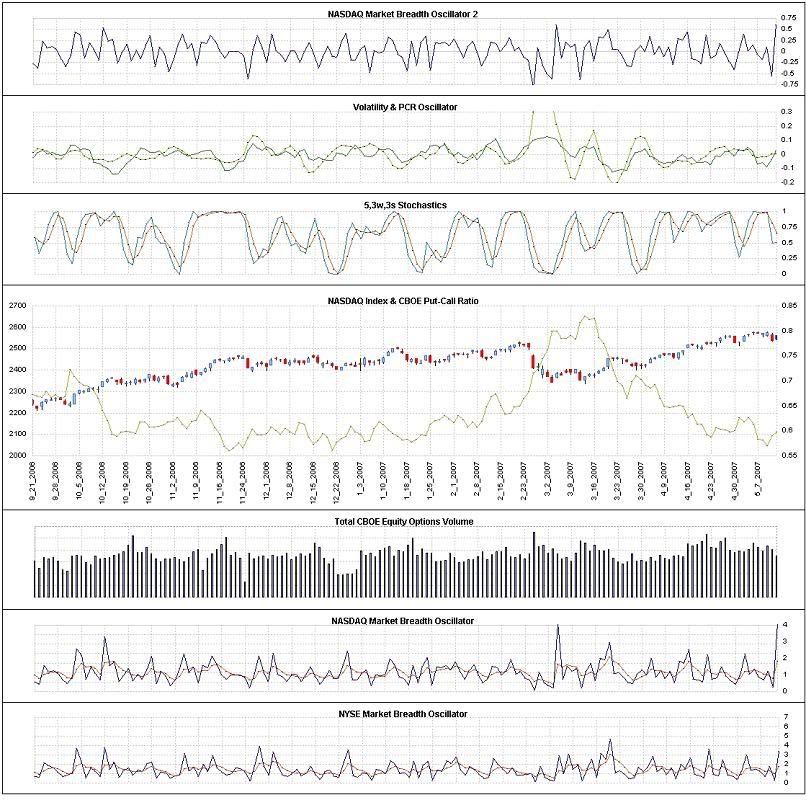
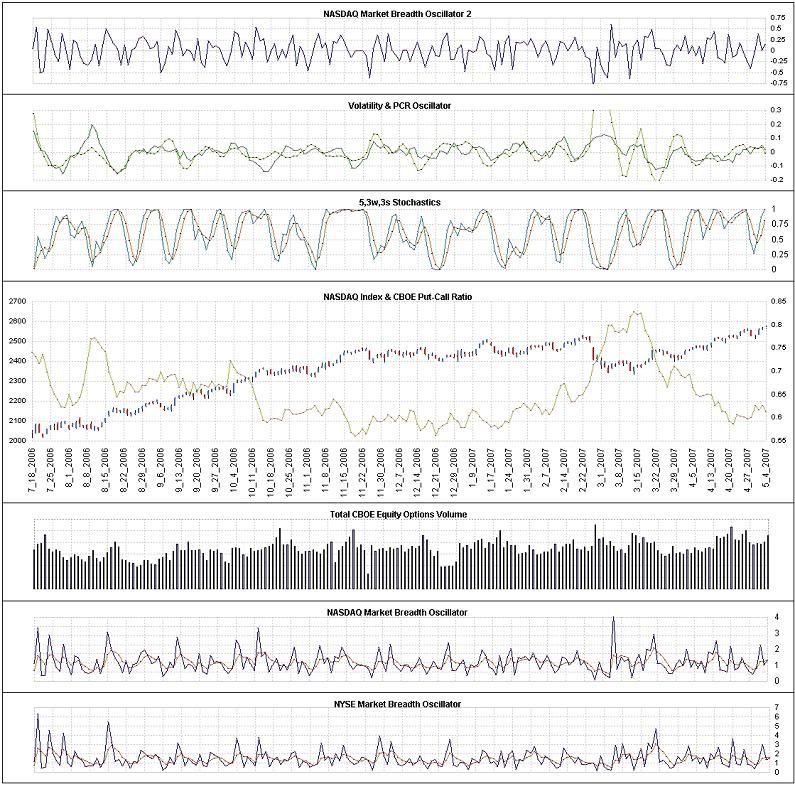
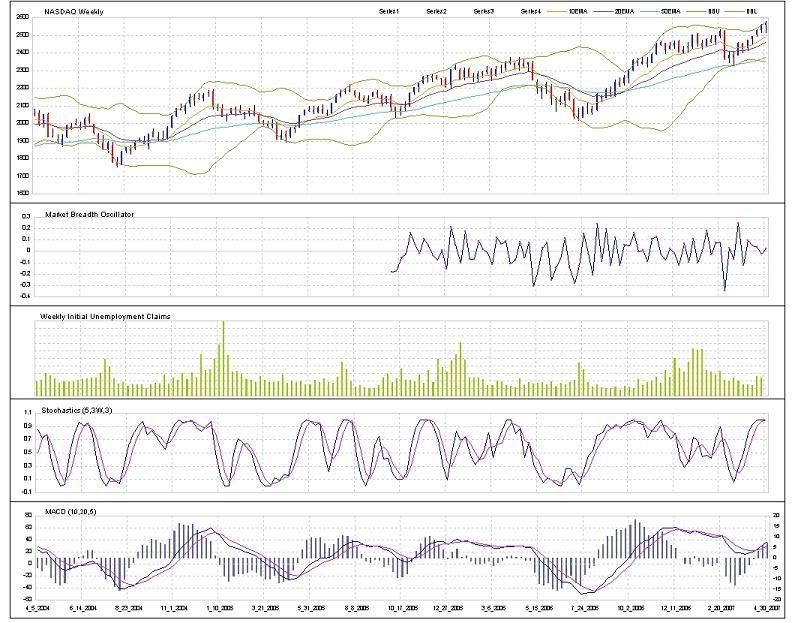
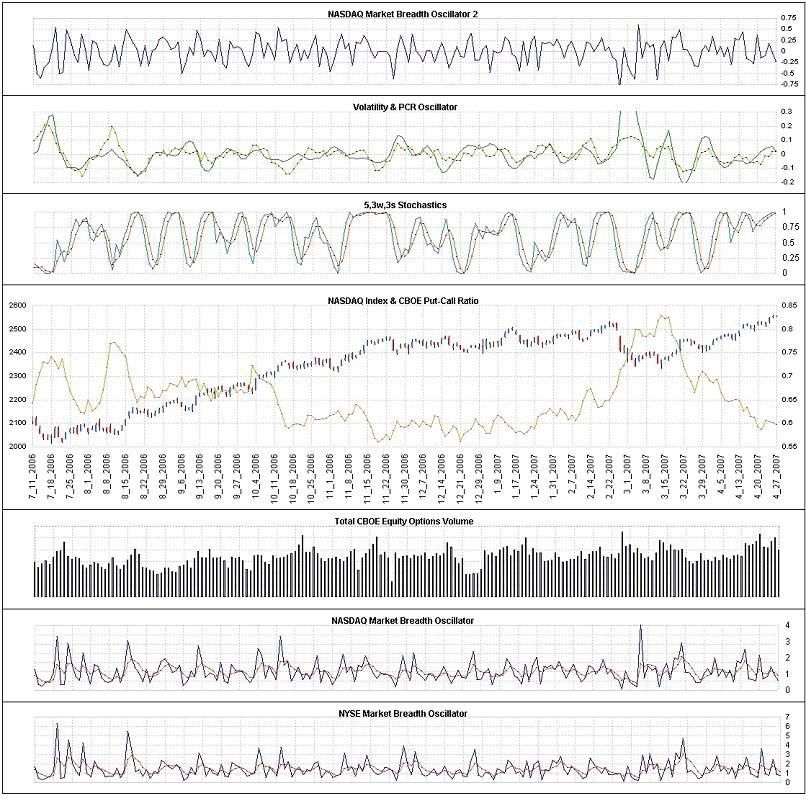
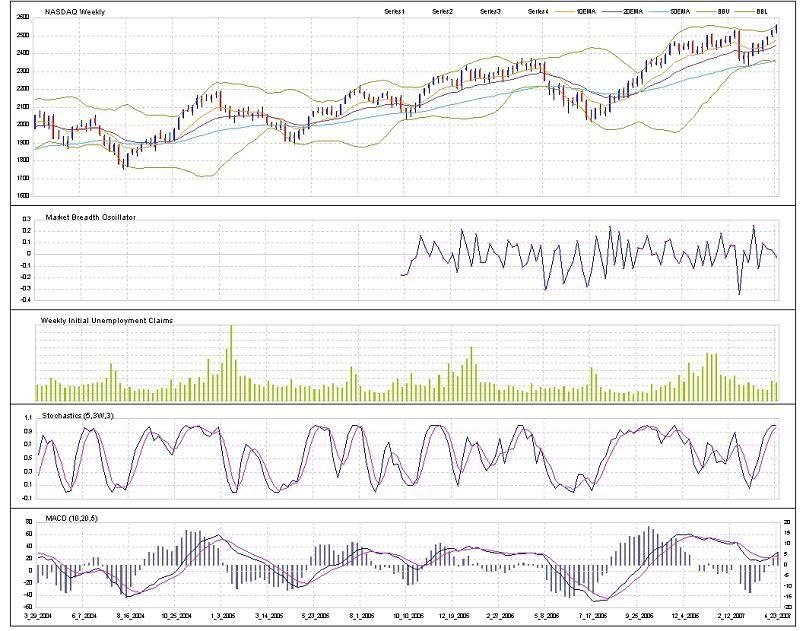
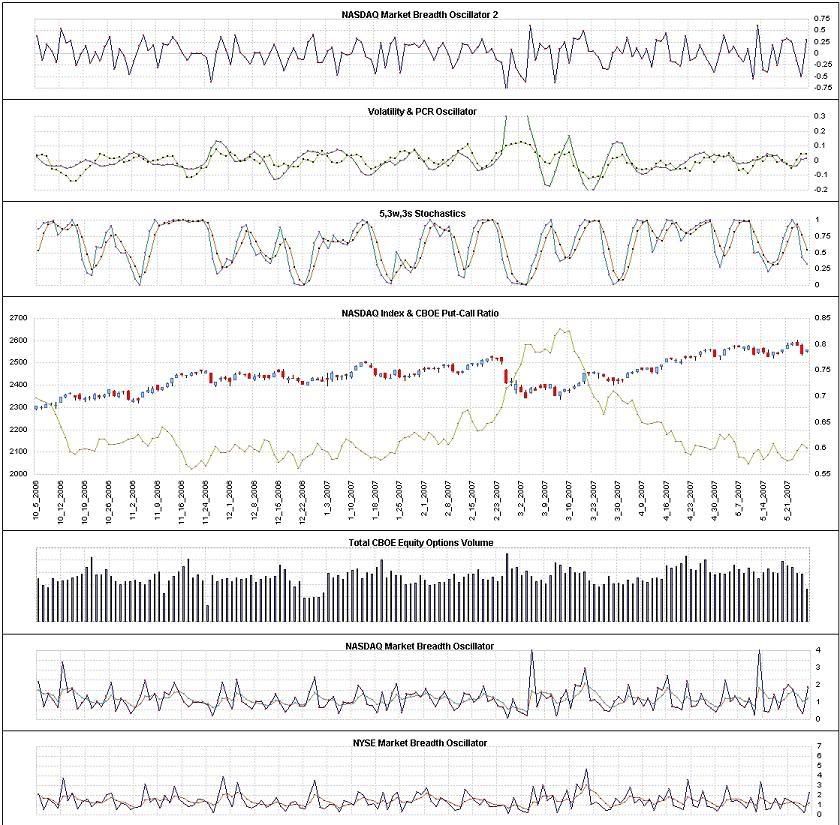
The NASDAQ composite fell last Wednesday and Thursday with an inside day on Friday. In japanese candlestick terminology, a harami has formed. But I would very much prefer to wait for a Harami-age (confirmation) before taking a position. Another reason being high market breadth readings while the stochastics is still going down does not show good returns.
On the close of last friday, here's what the short-term indicators are telling us:
(1) NASDAQ Market Breath Oscillator 2
Bounced from a significant low last Thursday to a high on Friday.
(2) Volatility Oscillator
Looks like a short-term peak
(3) Put-Call Ratio Oscillator
Similar to the Volatility oscillator. Suggesting a possibilty of a short term bottom.
(4) Stochastics Oscillator
Coming down
(5) Put-Call Ratio EMA :
Low put buying
(6) CBOE Equity Options Volume :
Falling - low interest in put options.
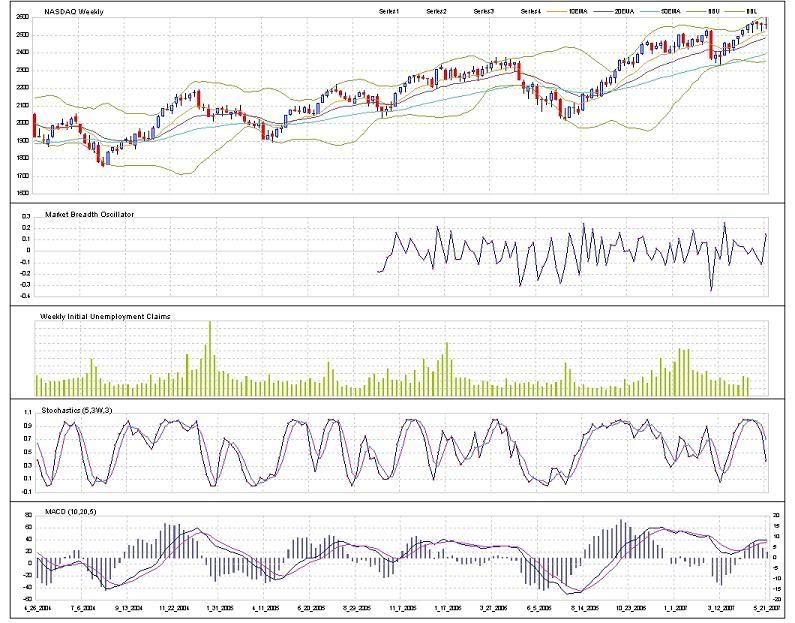
MEDIUM-TERM OUTLOOK
--------------------------------------
Here's how the indicators are shaping up:
Market Breadth Oscillator: Historically high reading.
Stochastics: Moved below the 50% level.
MACD: %k slightly above %d
Contrary to last week's expectation of the market closing higher, it made a new high but closed slightly lower instead. A good reason to cash out when the gains look good. The bear trigger remains unchanged at 2150 and because of the high market breadth reading, I'm not expecting an all out bull rally this week.
WHAT I'VE BEEN UP TO LATELY
----------------------------------------------------
Worked another 45 hours - excluding luch and break times - last week... still very overloaded. Worked 11 hours on Friday without lunch. Take a look at my daily tasks and tell me if you can fit lunch inside
845-930
1) Run Funds-Under-Management report
2) Run Transactions report
3) Run Processed Applications report
4) Run Processed Redemptions report
5) Print and report bank statements
930-1000
1) Receive mail
2) Date and time stamp them
3) Count the number of applications, redemptions & maintenance
4) Enter the amount, dealer group and adviser for applications for 2 funds
5) Do up an email and attach all report files
6) Print out the reports and email to be checked by a senior
7) Make amendments to report(s) or email if necessary
8) Send out the email
1000-1130
1) Process the applications
i) check if investor exists
ii) enter cheque details on cheque banking coversheet
iii) print the coversheet
iv) photocopy the coversheet with each cheque and all application forms
v) attach the photocopy behind the application forms
vi) enter investor details, bank account details and distribution instructions
vii) terrorism and public figure check
viii) enter the trade (i.e. assigning units to the investor)
viv) print out investor audit report to be checked by another person
x) get senior to check if the trade was entered correctly
2) Process the redemptions
i) go into archive
ii) search for investor folder
iii) check if signature on redemption request is the same as on application form
iv) enter the redemption details into the system
v) get senior to check and confirm
3) Receive the 2nd batch of mail at 1130
i) date and time stamp them
ii) process the applications and redemptions
4) Receive the yields for the retail funds
5) Receive the prices for the wholesale funds
6) Receive faxes for wholesale applications and redemptions
1130-230
1) Process the yields
2) Update yield checklist report
3) Upload the prices
4) Process wholesale applications
5) Process wholesale redemptions
- All retail and wholesale redemptions must be finished by 215 tough luck if there's too many
6) Check amount for each redemption and exit fees
7) Check amount for each wholesale redemption received on previous day
8) Prepare emails to be sent at 230
i) Add up number and total amount of retail applications
ii) Investor number, amount and name of each redemption
iii) How much money to be transferred into the fund's operating account
iv) How much money to be transferred from fund's operating account for redemptions
v) How much money to be transferred from fund's operating account for wholesale redemptions
9) Continue to process retail and wholesale applications
10)Receive faxes for wholesale applications and redemptions
230-400
1) Run and print scheduled payments report
2) Prepare and print coversheet for payments report
3) Get team leader or manager to generate ABA file (for direct crediting of investors' account)
4) Ring Treasury and get them to print out the ABA
5) Go down to treasury to collect the ABA
6) Attach the ABA and get 2 seniors to sign the coversheet
7) Photocopy the lot
8) Bring down the originals back to treasury
9) Continue to process the retail and wholesale applications
10)Prepare email to sent at 4pm
i) add up total amount of wholesale applications received
ii) add up total amount of wholesale redemptions received
iii) add up total amount of wholesale redemptions received previous day
iv) print email
v) bring email and all relevant faxes to senior for checking
400-500
1) Generate letters for new investors
2) Generate letters for new investors' advisers
3) Generate letters for wholesale applications
4) Generate letters for wholesale redemptions
5) Go to print room, put in letterheads for the fund
6) Go back and print out all relevant letters
7) Print out fax cover sheets for all wholesale applications and redemptions
8) Fax the letters for wholesale applications and redemptions
9) Wait for confirmation that the faxes have been sent
10)Photocopy all letters
11)Fold and insert letters into envelopes
12)Collate the documents for filing and inclusion into daily tradepack
Now that you've seen my daily tasks, do you see the word "Lunch" anywhere?
These are just the daily tasks... I have not even included the phone calls, the emails, the peculiar requests, and also updating of investor details (e.g. change of address, change of adviser, etc etc etc).
On top of that, there are weekly Regular Savings Plans to process, fortnightly upfront commissions to advisers, monthly regular withdrawl instructions, monthly trail commissions to advisers and monthly fund distributions.
I think its about time to move.
Have a gd week!
posted by SmokingFlax @ 12:01 PM
0 comments
![]()