MY TAKE ON INVESTING

Like everyone else, there is only one reason why I study, analyse and participate in the financial markets - and that is to make money. But the difference with me and most other people is that I am willing to use anything (legally) possible to do it. If counting the number of cockroaches that I see everyday gives me an edge in the market, I'll do it. If it works, I'll use it; be it keeping tabs on the economy, looking at charts and indicators (technical analysis), looking at value or growth potential (fundamental analysis), profits & earnings + other related market activity (quantitive analysis), through insider activity + consumer surveys (sentiment analysis) and yes even astrology.

I've spent over five years monitoring, studying, observing and trading the financial markets. My quest was to find out what makes the financial markets move, to find something substantial, something that will provide consistent monetary gains. I don't want to just accept what other authors say/write as gospel truth, I want to know why. In 2005, I took a masters degree in finance to see if what they teach in the university adds any value towards investing success - the answer is 'not really'. Investment knowledge builds up with time - what might seem unimportant to you now may become what you need to get you to the next 'level'. Such is my experience with fundamental, quantitative, economic and sentiment analysis.

What you see in this blog represents quite a number of item(s) and technique(s) that have met - like what W.D. Gann says - my '(utmost) satisfaction' and I hope that they can be of use to the investment pilgrim who's also on a quest for understanding and success.
Please Support This Blog By Clicking On The Advertisement(s) In The Sidebar If The Content Has Been Helpful To You. Thanks.

Sunday, April 22, 2007

SGX Insider and Substantial Shareholder transactions for 16 - 20 Apr 07 & Market Commentary

Hi all,

Here are the more significant Insider and Substantial Shareholders transactions reported on the Singapore Stock Exchange in the past week:


ASIA-PACIFIC MARKETS COMMENTARY
-------------------------------------------------------
China makes the headlines once again in the last week, with the fear that the Chinese Authorities would raise interest rates in China because of an overheating economy. The funny thing is that the press did not bother to dig a little deeper to present its readers with supporting evidence(s) in terms of facts and figures. All we've been shown are the CPI numbers. Who's to say that a Y-O-Y reading of 3% on the CPI means that inflation in China is getting out of hand? This magic number applies to the US, but does it apply to China? Maybe there are economic reports out there supporting the magic number, but I've yet to come across it. And I believe that it will quite certainly be worth one's while to dig deeper as the China market still has much untapped potential.

Now it seems like the other Asian Pacific markets have a new influencing variable besides the U.S. market.

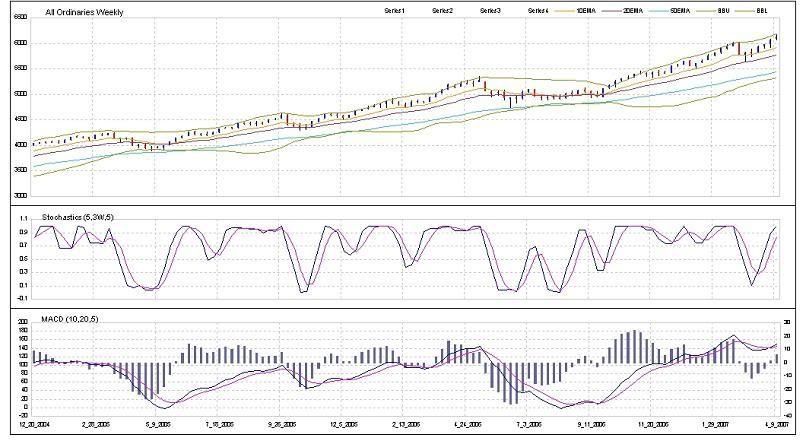
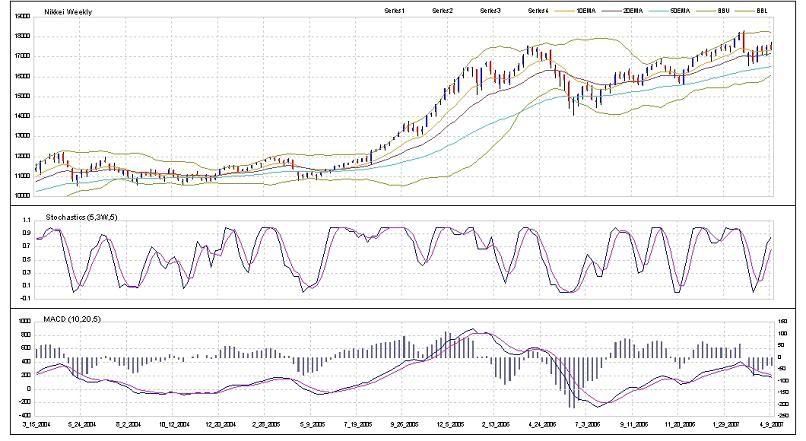
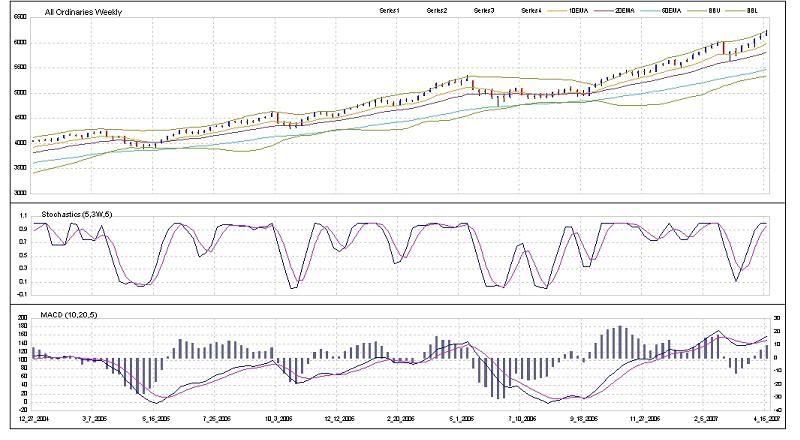
From the charts, the All Ordinaries performed the strongest compared to the Straits Times and Nikkei 225 Indexes.

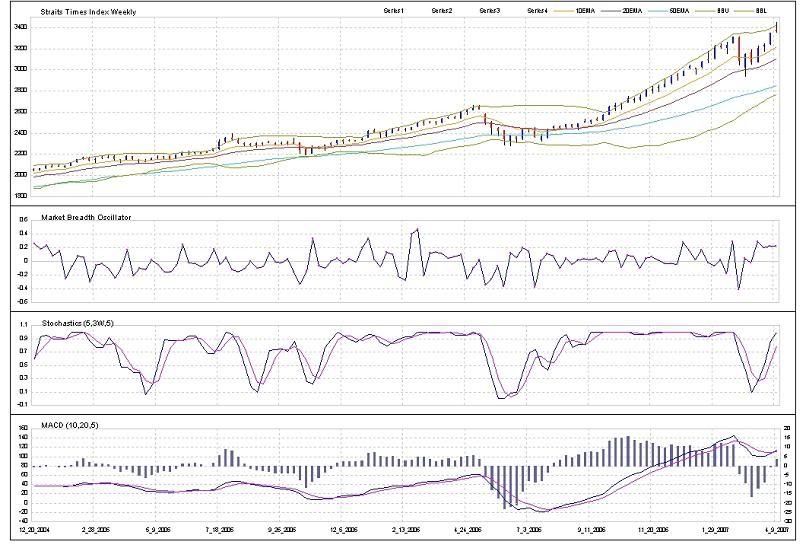
Long shadow dojis appeared on both the Straits Times Index and the Nikkei 225 suggesting uncertainty in both markets while there's no bearish indication on the All Ordinaries except for the overbought stochastics.

The Market Breadth Oscillator for the Straits Times Index has declined slightly from last week's high reading. So last week's call for either a down or sideways move was on the money.

Overall, the picture from the technical point of view remains unchanged - bearish, with the market still able to continue to move up at a very gradual pace. Small up candles, yes, large up candles, not likely - unless new fundamental/economic data comes up.


US MARKET COMMENTARY
--------------------------------------
Subprime mortgage stories continue to dominate the headlines on the U.S. front with lenders starting to tighten up their lending criteria as the number of defaults rise.

SHORT-TERM OUTLOOK
-----------------------------------
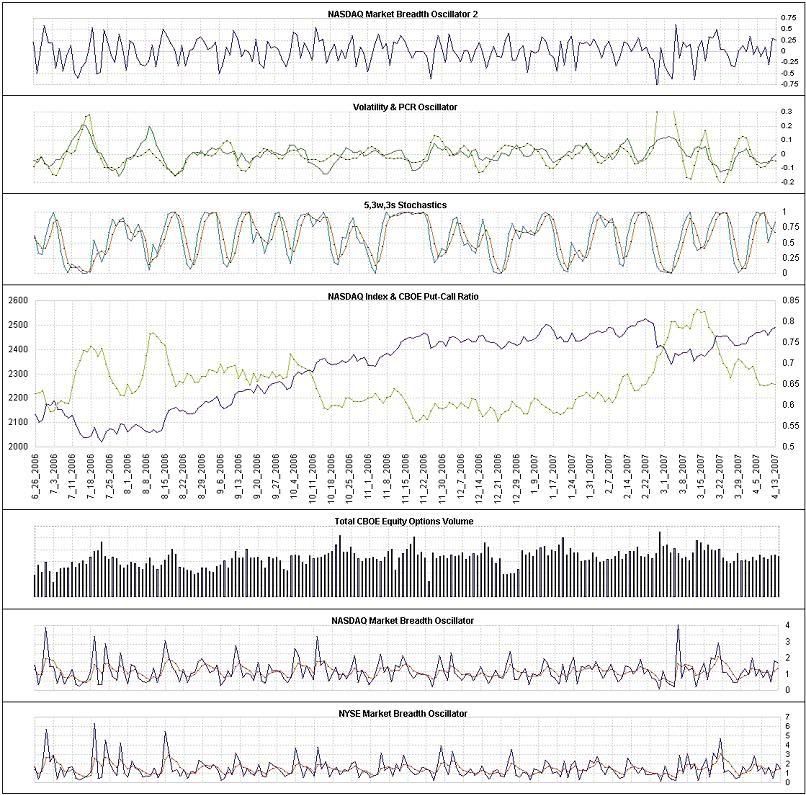
The Nasdaq Composite continued to remain bullish (i.e. made new high) but at a very controlled pace. The Volatility and PCR oscillators are in one of those rare situations where they are not ocsillating.

On the close of last friday, here's what the short-term indicators are telling us:
(1) NASDAQ Market Breath Oscillator 2 : 0.37
(2) Volatility Oscillator : -0.013
(3) Put-Call Ration Oscillator : -0.054
(4) Stochastics Oscillator : Fell to 68 and back up
(5) Put-Call Ration EMA : Falling
(6) CBOE Equity Options Volume : High

The MBO is now in high ground, with a high possibility of coming down.

The Volatility and PCR Oscillators are moving sideways.

The falling PCR suggests bullish sentiment in the market and the high volume suggests widespread interest by the participants.

So on an overall basis, there are some indication of the likelihood of future market direction in the short run. The possibility of the bull move continuing to materialise is still present. But the high reading on the MBO suggests that there might be a short (as short as 1-day) pullback early this week.
Also the increase in the buying of call options increased the likelihood of a swing coming in.


MEDIUM-TERM OUTLOOK
--------------------------------------
The Index closed up for another week, outperforming all other Asian Pacific markets as the U.S. remained relatively unaffected by the sell down that started in the Chinese market. Prices remained strong thus far.

Here's how the indicators are shaping up:
MBO: Pulled back slightly
Stochastics: Overbought, but still bullish
MACD: %k and %d crossover

The pull back on the MBO and a bullish stochastics suggest that the index is yet again likely to finish higher this coming week. The 10 and 20 period moving averages are still the indicators to watch closely because a break down through them has bearish implication(s).

The outlook remains unchanged with the possibility of trend continuation but with the likelihood of a top forming.


WHAT I'VE BEEN UP TO LATELY
----------------------------------------------------
I will be starting work this week at BNP Paribas (Sydney) on a contract basis doing fund adminstration/unit registry. Had two interviews last week, one at Morgan Stanley, and the other at BNP. The interview at BNP was much more spontaneous and relaxed than the Morgan Stanley one. A testament to the difference in the culture of these two organizations. I'm glad that Morgan Stanley said 'no' as I would've have joined if they offered simply because it was Morgan Stanley, but I believe that I would be much happier at BNP.

So that means my weekday fishing trips have temporarily come to an end.

Have a gd week!

Sunday, April 15, 2007

SGX Insider and Substantial Shareholder transactions for 09 - 13 Apr 07 & Market Commentary

Hi all,

Here are the more significant Insider and Substantial Shareholders transactions reported on the Singapore Stock Exchange in the past week:


ASIA-PACIFIC MARKETS COMMENTARY
-------------------------------------------------------
There are no major economic news from the APAC region in the past week. Taking their cue from the US Market, the Australian, Singapore, Hong Kong and Japanese markets all finished higher for the week.

From the charts, the All Ordinaries and Straits Times Indexes did indeed outperform the Nikkei 225 as expected. The flipside being that the All Ords and Straits Times Indexes have both reached overbought levels while the Nikkei finished lower.

A doji appeared on both the charts of the All Ordinaries and Straits Times Indexes with the latter having a more bearish intonation - close enough to be called a Shooting Star Doji in my opinion. Furthermore, the Shooting Star also penetrated the Upper Bollinger Band. The candlestick formation on the Nikkei is also bearish with no other explanation other than that of underperformance in relation to the other indexes.

The Market Breadth Oscillator for the Straits Times Index (This week's new addition) continues to remain in high ground, and if past behaviour is a valid guide, the chances of any substantial rally this coming week is not high.

Overall, although the picture looks bearish from the technical point of view, the markets can still continue to move up at a very gradual pace. Small up candles, yes, large up candles, not likely - unless new fundamental/economic data comes up this coming week.


US MARKET COMMENTARY
--------------------------------------
The only two sets economic data that was released last week that I'm more concerned about are the Producers Price Index and the preliminary Consumer Sentiment Index. The minutes of the FOMC are also important, but I usually leave it to others to read it and let them summarize for me.

The PPI came in above market consensus but below the reading for the prior month while the Core PPI was below both the market consensus and the prior month's reading. Both a sign of weakness.

The same story for the UMich CSI - readings below the consensus and prior month.

Read an interesting article by Bill Gross, PIMCO's lengendary bond man, about the situation of the current housing market in the US. It states that the housing market is about 15-20% overvalued at the moment, and would likely stay below its peak for the next three years or so. As consumer spending weakens, the FED will have to look towards other means of stimulating the economy - and that is to lower interest rates.

For Bill, the lower interest rates would mean a rally for bond prices, but it might not be a done deal for equities. In the recession from 2000 to 2003, rates were lowered at a frantic pace until the recovery in early 2003. So one should keep an eye on inventory levels (i.e. order books), productivity and earnings.

SHORT-TERM OUTLOOK
-----------------------------------
Last week, the analysis was suggesting a short term top in the NASDAQ Composite. The index did pull back for only one day, but decided to go back up. So anyone who went short would've had to cut loss. Goes to show again that there is no holy grail.

On the close of last friday, here's what the short-term indicators are telling us:
(1) NASDAQ Market Breath Oscillator 2 : 0.26
(2) Volatility Oscillator : -0.045
(3) Put-Call Ration Oscillator : 0.0005
(4) Stochastics Oscillator : Fell to 50 and back up
(5) Put-Call Ration EMA : Sideways
(6) CBOE Equity Options Volume : Average

The MBO shot up to high ground and remained there last friday.

The Volatility and PCR Oscillators are not doing much.

The sideways PCR suggests mixed sentiment in the market and the average volume suggests average interest by the participants.

So on an overall basis, the indicators are not providing any strong indication of what might happen in the short run. There is every possibility that it might continue to stay bullish - making the momentum traders very happy but sidelining the swing traders. This alternating between swinging and momentum behaviour by the market is the reason why no one wins all the time. I do believe that there are very capable traders out there who are equally skilful in swing and momentum trading, but majority would usually end up paying school fees trying to second guess what the market's gonna do next.


MEDIUM-TERM OUTLOOK
--------------------------------------
Last week, the MBO sugests a higher possibility of either down or sideways, and it turned out to be wrong. It pull back, but the index closed higher instead.

Here's how the indicators are shaping up:
MBO: Pulled back slightly
Stochastics: Overbought, but still bullish
MACD: %k and %d converged

The pull back on the MBO and a bullish stochastics suggest that the index is likely to finish higher this coming week. I'm watching the 10 and 20 period moving averages closely because a break down through them has bearish implication(s).

I'm not expecting abrupt bull moves in the next few weeks given the high level of the stochastics, the MACD and my monthly indicators - similar to the outlook of the Asia Pacific markets.


Have a gd week!

Sunday, April 08, 2007

SGX Insider and Substantial Shareholder transactions for 02 - 05 Apr 07 & Market Commentary

Hi all,

Here are the more significant Insider and Substantial Shareholders transactions reported on the Singapore Stock Exchange in the past week:


ASIA-PACIFIC MARKETs COMMENTARY
-------------------------------------------------------
There are no major economic news from the APAC region in the past week. Taking their cue from the US Market, the Australian, Singapore, Hong Kong and Japanese markets all finished higher for the week.

From the charts, the All Ordinaries and Straits Times Indexes have both recovered back to pre-selldown levels while the Nikkei is not performing as well. Going forward, the All Ords and the STI would probably still be outperformers until a major macro-economic event causes the institutional investors in these markets to make drastic adjustments.


US MARKET COMMENTARY
-------------------------------
The news front was relatively quiet on the US side as well with the focus now shifting back to oil and Middle Eastern developments. It's times like these that I rely on Technical Analysis to tell me what the markets are up to, and reading every financial paper or financial website out there is not my cup of tea.

SHORT-TERM OUTLOOK
----------------------------
The analysis from last week was on the money again... we expected either a rally or pullback and had the gauges in place. From the MBO, the days to buy were 2nd and 4th of Apr respectively.

On the close of last friday, here's what the short-term indicators are telling us:
(1) NASDAQ Market Breath Oscillator 2 : 0.117
(2) Volatility Oscillator : -0.07
(3) Put-Call Ration Oscillator : -0.053
(4) Stochastics Oscillator : Oversold
(5) Put-Call Ration EMA : Falling
(6) CBOE Equity Options Volume : Average-Low

The MBO is only slightly positive, not enough to provide any substantial clue of possible direction in the next few days. But since the stochastics is still rising, chances are, the index still has some kick left.

The Volatility and PCR Oscillators have fallen to levels where short-term tops can happen.

The falling PCR suggests an increase in call buying but the average-low volume also suggests that the call buying is not convincing.

So on an overall basis, the likelihood of a short-term top setup is pretty high. But as always, triggers (buy and sell stops) need to be in place to trade in whichever the market decides to go... the outlook is but a sign post.


MEDIUM-TERM OUTLOOK
-----------------------------
I've now also added the Market Breadth Oscillator to the weekly NASDAQ chart, and it is used in the exact same way as the short term chart.

Here's what I see from the indicators:
MBO: 0.098
Stochastics: Reaching overbought
MACD: %k and %d converging

The MBO suggests that the coming week is either down or sideways.


Have a gd week!
Posted by Picasa

Sunday, April 01, 2007

SGX Insider and Substantial Shareholder transactions for 26 - 30 Mar 07 & Market Commentary

Hi all,

Here are the more significant Insider and Substantial Shareholders transactions reported on the Singapore Stock Exchange in the past week:


The number of transactions reported over the past week was quite numerous, with the number of sell transactions greater than last week's. The selling by directors of Allgreen and Hotel Properties have also decreased. I shall leave it to the reader to browse through the transactions.

ASIAN MARKET COMMENTARY
-----------------------
There were no major economic news from the Asian markets and as usual, most of their movements were influenced by what's happening in the US. The Straits Times and the Hang Seng Indices were more or less range bound while the Nikkei was on a small down trend. On the basis of relative strength, the Singapore and Hong Kong bourses fared better than their Japanese counterpart.

On the technical side, the weekly Nikkei chart is still hanging around its 10 week moving average. Stochastics is still at a low level suggesting there's still room to move on the upside. A strong indication of the resumption of the bull move would be when the 17,600 mark is broken, which is only about 200 points away. 200 points for the Nikkei in a day is a stroll in the park. But on the other hand, a breakdown through the 17,000 mark means the bears are gaining control.


US MARKET COMMENTARY
--------------------
The Consumer Sentiment Index reading dropped to 88.8 for the month of Mar'07, down from the 91.3 value in Feb'07. The core-PCE component of the Personal Income and Spending report edged up to 2.4% from 2.2%, causing widespread worry that the Fed would not be cutting rates and may even be raising rates. Another indicator that suggests the economy is still going strong is the Purchasing Manager's Index, which came in at 61.7 - a very strong reading after the index was bumping around the +-50% range for a few months. If this phenomenon holds up, the likelihood of a rate cut any time soon is going to be quite thin.

The other cause of fear of rising inflation is the rise in oil prices over the past week. It reached an intraday high of $68 per barrel and is now settling at around the $62 mark at the close of the week. The technical oscillators for oil are now in overbought territory and the likelihood of a correction or sideways move would be greater than a continued upmove. A more prudent trading strategy would be to wait for a move back to the 20 period moving average and buy when the stochastics head up again.

Earnings season is just a couple of weeks away, and if the theory holds true, the stocks of companies expected to do well are gonna get bought up leading to the earnings announcement day.

SHORT-TERM OUTLOOK
------------------
The short top that was suggested last week played out nicely with the NASDAQ composite falling from 2455 to 2417, and almost unchanged for the last two trading days of the week.

On the close of last friday, here's what the short-term indicators are telling us:
(1) NASDAQ Market Breath Oscillator 2 : 0.135, up from low of -0.347
(2) Volatility Oscillator : 0.13, up from -0.21
(3) Put-Call Ration Oscillator : 0.02, up from -0.115
(4) Stochastics Oscillator : Oversold
(5) Put-Call Ration EMA : Rising but fell on Fri
(6) CBOE Equity Options Volume : Low

The MBO is only slightly positive, not enough to provide any substantial clue of possible direction in the next few days. But due to the oversold stochastics, the index could either move up and push the MBO into significant high ground, which increases the possibility of a short (usually one-day) pullback before resuming, or a further drop past the 2380 - 2400 support zone to set the tone for a possible rally once the MBO falls to a significant low level.

The Volatility Oscillator is at a level where reversals have a high probability of happening, while the PCR Oscillator is of a non-significant value.

So on an overall basis, there are two possibilities that can happen (i) market starts to rally, pulls back slightly and rallys again (ii) market sells off some more, then reverse and head up.


MEDIUM-TERM OUTLOOK
-------------------
I've now also added the Market Breadth Oscillator to the weekly NASDAQ chart, and it is used in the exact same way as the short term chart.

Here's what I see from the indicators:
MBO: Currently at where index moves up the following week
Stochastics: Just recovering from oversold
MACD: Bearish

Just like the Nikkei, it seems like the indicators are not in agreement, and the index can go both ways. A bullish confirmation happens when the 2460 mark is broken and a bearish confirmation when the index falls below 2380.

Integrating the weekly analysis with the monthly indicators, I do not think the index would stage a rally like the one in late Jul'06, because the market would be more likely to move either sideways or downwards. But there is still money to be made by trading the market swings even if a sideways move does materialise. The key is to be flexible.


Have a gd week!
Posted by Picasa